|
WELCOME
Weekly selected highlights in flow control, treatment and combustion from the many McIlvaine publications.
· Predicting the Profitability of Air Pollution Control Companies
· Sucking the CO2 Out of the Air
· Detailed Valve Market Share Forecasting
Predicting the Profitability of Air Pollution Control Companies
Why is it that some of the largest U.S. and European based air pollution control companies have failed while some of the smaller ones have thrived? We asked one smaller APC company why it is successful and were told that it is the ability to combine a range of services and technologies to meet the customer needs. Here are their secrets to success.
· Broad industry coverage: The company recognizes that the customer needs differ by industry from year to year. So when coal fired boiler pollution control needs are down the gasifier, kiln, dryer or furnace market may be up. The company has been quite successful in the frac sand manufacturing market and has a torrified biomass production plant.
· Continuing innovation: The company has patented a new dry recirculating acid gas scrubber and has efficient systems for mercury reduction using brominated activated carbon injection. It has recognized the potential for direct sorbent injection based on pre testing of injection locations and is supplying cost effective solutions. The company is known for its innovations in the design of fabric filters. A new patented dryer has demonstrated improvements over available designs.
· Quick and reliable system design: A large engineering staff provides the range of mechanical, electrical, and structural design needs. It also supplies balanced duct design, hoods and chutes as needed.
· Design and supply of auxiliary systems: The company is providing both vacuum and pressure pneumatic conveying at the production plants as well as in bulk storage facilities. It has an in-house automated controls and power design group.
· Fast and cost effective construction: The company has its own construction crews and a proven record.
· Lifecycle support: The company has a large repair parts inventory and extensive service capabilities. It offers the full range of services: advise, design, supply, construct, guide, maintain. This can include training and even operational support.
In the last decade this company has grown sales by more than 10 percent per year. Some of the public companies in the same business in Europe and the U.S. have shown large sales decreases. Part of this failure is just the reliance on the coal fired boiler market. Part of it may also be failure to fully integrate the life cycle support activities. The potential for remote O&M was not realized. There was no aggressive after-market support staff. By contrast this high performing company has a staff of capable sales engineers to make sure customers know about and take advantage of the best repair part options.
This leads to questions about another path. Some air pollution related companies have opted only to sell components and eliminate the risks associated with system sales. However with remote monitoring and the potential for third parties to operate air pollution control systems the component companies may find their margins and revenues shrinking as the third party operators look for ways to reduce cost.
The various paths to profitability in the air pollution control industry are analyzed in 5AB Air Pollution Management
Sucking the CO2 Out of the Air
The one power generation option, which is carbon negative, is biomass combustion with CO2 sequestration. If presently all the CO2 from biomass combustion were sequestered, it would have a greater effect on greenhouse gas reduction than all the wind and solar plants combined. What if wood chips were shipped to the Permian basin instead of to the UK? Biomass-fired power plants could provide heat, power, and CO2. Modular CO2 liquefaction plants could provide truckable liquids, which along with the sand, are delivered to the fracking sites. The liquefied CO2 would result in greater oil and gas extraction per well and eliminate water disposal problems.
The UK Renewable Energy Association points to the Drax CO2 capture pilot plant, which is the first such effort for sequestration from a biomass-fired boiler as being much more than just a carbon neutral approach. It is the equivalent of “sucking the CO2 out of the air.”
There is another positive aspect of biomass-fired boilers. They lend themselves for use in combined heat and power. This means net efficiency can be 70 percent instead of 35 percent. The waste heat from the electricity generation is used beneficially for heating, cooling, or other industrial and residential processes.
Here is another phenomenon to consider. The increased CO2 in the atmosphere is being cited as the reason the earth is greener. Commercial greenhouses add 200 ppm to the air and achieve 40 percent higher rates of growth. The increase of 10 or 20 ppm in the atmosphere is having a similar effect on the world’s vegetation. As a result, the feed stock for biomass combustion is becoming more economically available.
Biomass-fired power delivers more electricity than wind or solar. If the CO2 from these boilers were used for enhanced oil recovery or other purposes, which involved sequestration, the impact on climate change would be much greater than any of the carbon neutral processes.
Drax Group has announced that carbon dioxide has been captured at the bioenergy carbon capture and storage (BECCS) pilot at the Drax Power Station. The pilot uses technology developed by C-Capture, a spin-out from Leeds University. Drax announced the achievement on February 7, noting the project represents the first time carbon dioxide has been captured from the combustion of 100 percent biomass feedstock anywhere in the world. The demonstration project will capture 1 metric ton per day of carbon dioxide. If the BECCS pilot can be scaled up, the Drax Power Station could produce carbon-negative electricity in the future.
According to Drax, engineers began commissioning the pilot plant in November. The first carbon is now being captured, which Drax is proving the proprietary solvent developed by C-Capture can be used. The demonstration project will capture 1 metric ton per day of carbon dioxide.
“This represents a major milestone on the road to achieving negative emissions through BECCS, which is going to be so important in the future,” said Chris Rayner, founder of C-Capture and professor of organic chemistry at the University of Leeds.
The UK Renewable Energy Association has spoken out in support of the BECCS pilot project at Drax. “This project shows that the UK can be a world leader in this cutting-edge technology, which is vital to limiting climate change,” said Benedict McAleenan on behalf of Biomass UK. “Just cutting carbon emissions isn’t enough—we need to actually suck CO2 out of the air and lock it away.
Drax announced plans for the BECCS pilot in May 2018 and said it would invest £400,000 ($514,520) in the project. Less than one year later, in November 2018, the BECCS project began commissioning. Earlier this month, C-Capture announced it has raised £3.5 million in new equity funding in a round led by BP Ventures, Drax and IP Group.
“Modern bioenergy is the overlooked giant of the renewable energy field,” said Fatih Birol, executive director of the IEA. “Its share in the world’s total renewables consumption is about 50 percent today, in other words, as much as hydro, wind, solar and all other renewables combined. We expect modern bioenergy will continue to lead the field, and has huge prospects for further growth. But the right policies and rigorous sustainability regulations will be essential to meet its full potential.”
Information released by the IEA shows that modern bioenergy, excluding the traditional use of biomass, was responsible for half of all renewable energy consumed last year, providing four times the contribution of solar, photovoltaic (PV) and wind combined. The IEA said most modern bioenergy is used in final energy consumption to deliver heat in buildings and for industry.
The IEA report shows bioenergy will be the largest source of growth in renewable consumption over the next five years. Bioenergy in the form of solid, liquid and gaseous fuels will account for 30 percent of the growth in renewable consumption from 2008 through 2023. The IEA said this is a result of the considerable use of bioenergy in heat and transport, which account for 80 percent of final energy consumption.
Although bioenergy will remain the predominant source of renewable energy in 2023, the IEA said its share of total renewable energy will decline slightly, from 50 percent in 2017 to 46 percent in 2023.
World Bioenergy Power Generation
The one big question about sucking CO2 out of the air is finding an economical use for it. Enhanced oil recovery is already proving to be cost effective. The problem is matching power generation and recovery activities. Hydraulic fracturing is growing rapidly and with it consumption of water. In the case of the Permian basin water use is becoming a big issue. So the potential to use liquid CO2 and sand as the proppant could be a winner.
Right now carbon dioxide fracking is used in places like Wyoming, which already has carbon dioxide pipelines. Economics alone could justify building more in some places, says Robert Dilmore, a research engineer at the U.S. National Energy Technology Laboratory.
This approach might make sense in China, where the best shale gas deposits are in arid areas. One of the largest shale gas resources in the world is the Tarim Basin in northeast China, located beneath the Taklamakan Desert—one of the largest sandy deserts in the world, with nearly 300,000 square kilometers of shifting dunes. Piping in water would strain already tight supplies. However, China has one million MW of coal-fired power capacity and lots of carbon dioxide—it’s just not capturing and using it.
Fracking with carbon dioxide has a number of potential advantages. Not only would it eliminate the need for millions of gallons of water per well, it would also eliminate the large amounts of wastewater produced in the process.
Water-free fracking could also solve other problems. In conventional fracking, half the water pumped into a well flows back to the surface, but the other half stays in the rock formation. The water that’s left behind can block the path of the natural gas, slowing down production and possibly decreasing the total amount a well can produce over its lifetime.
Carbon dioxide can also result in a better network of fractures, making it easier to extract the fuel. Once infrastructure is in place to deliver carbon dioxide, it can be used to enhance production later in the life of a well. In any shale gas deposit, a large fraction of the natural gas sticks to the shale rather than flowing out. But carbon dioxide has a greater affinity for the shale than natural gas does, so it can be used to displace the fuel and free it from the rock.
After the well is done producing, it can be sealed up, storing the carbon dioxide permanently underground.
To be sure, carbon dioxide fracking poses many challenges besides the lack of infrastructure. Unlike water, gases are compressible, so it’s more difficult to reach the pressures needed to fracture the rock. Also, the carbon dioxide has to be separated from the natural gas before shipping the fuel to market, which adds to costs. And, it will probably never be economical to install carbon dioxide pipelines all the way to every fracking well. Trucks will be needed to convey the carbon dioxide the last mile—more trucks than would be needed with water fracking. That could increase local noise, pollution, and road damage.
The lack of infrastructure can be overcome with technologies such as modular CO2 liquefaction facilities. A Black & Veatch-designed coal-fired gasification plant with an LNG–in –a –Box delivers LNG by truck to power plants from a location in central China. Biomass-fired or coal- fired CHP power plants could deliver CO2 in the same manner.
CO2 is a global problem and requires global solutions. Saudi Arabia generates power with oil and gas-fired power plants. Why not export this oil and gas and import coal. The cost for African coal transport is low. The enhanced oil recovery market in Saudi Arabia is increasing rapidly as reserves are being depleted.
Biomass fuel is already being shipped long distances. Wood pellets are produced in the U.S. and transported to Europe for use as biofuels. These pellets could just as easily be transported to the Permian basin to generate power, heat and CO2.
For more information on this technology click on
N049 Oil, Gas, Shale and Refining Markets and Projects
Bob McIlvaine can answer your questions and can be reached at 847 784 0012 ext. 122 rmcilvaine@mcilvainecompany.com
Detailed Valve Market Share Forecasting
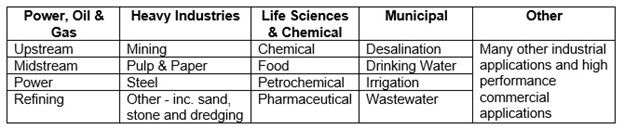
Detailed forecasting of market shares by valve type and industry are available. Valve forecasts are first segmented by control vs on/off and then by eight valve types and then by fifteen industries. This results in 240 forecasts for each supplier.
There are no authoritative sources for valve sales and certainly not for market shares. In fact since many valves are sold through distributors the supplier may not know how many of his valves are being purchased by a particular industry. However, it is well worthwhile to create approximate segmentations. A detailed analysis is much more valuable for decisions relative to R&D, sales, and manufacturing than a general forecast. Here is an example showing estimated 2018 Metso globe control valve sales.
|
Metso
|
|
|
Globe - $ mil
|
|
Industry
|
On/Off
|
Control
|
|
Total
|
|
|
|
Chemical
|
|
35
|
|
Electronics
|
|
|
|
Food
|
|
|
|
Iron & Steel
|
|
|
|
Metals
|
|
|
|
Mining
|
|
|
|
Oil & Gas
|
|
43
|
|
Other Electronics
|
|
|
|
Other Industries
|
|
|
|
Pharmaceutical
|
|
|
|
Power
|
|
40
|
|
Pulp & Paper
|
|
|
|
Refining
|
|
39
|
|
Wastewater
|
|
14
|
|
Water
|
|
|
|
Metso 2018 Globe Control Valve Sales and Market Shares
for Selected Industries
|
|
Industry
|
Estimates of Metso 2018 Sales $ millions
|
World Valve Sales $ millions
|
% of total valve market
|
|
Chemical
|
35
|
1162
|
2.0
|
|
Power
|
40
|
1739
|
2.3
|
|
Refining
|
39
|
1606
|
2.4
|
|
Wastewater
|
14
|
789
|
1.7
|
Estimated Metso sales range between 1.7% to 2.3 % for control globe valves in selected industries. Market shares in some other industry/valve type categories are just a fraction of 1%. Metso is the 7th largest valve supplier. Its total market share is 1.4%. Its share in control valves is higher than in on off valves.
Similar forecasts are available for the valve types shown in the following chart.
|
Valve Type
|
On/Off
|
Control
|
|
Ball
|
x
|
x
|
|
Butterfly
|
x
|
x
|
|
Check
|
x
|
x
|
|
Gate
|
x
|
x
|
|
Globe
|
x
|
x
|
|
Plug
|
x
|
x
|
|
Other
|
x
|
x
|
|
Safety Relief
|
x
|
x
|
The accuracy of the forecasts and value are a function of the amount of effort needed to make the forecasts.
The output can be viewed as a range from a police sketch through a 240 piece puzzle. The least expensive is the police sketch. Some details are known but the rest have to be guesstimated. A victim is more likely to identify a perpetrator if shown a sketch that expands upon known details. The same is true of valve market analysis. The total market share estimate is best determined by aggregating the 240 components even if some of them are uncertain but minor.
The ideal output is the 240 piece puzzle where each of the components is known. This ideal is rarely achieved. One of the challenges is that each one of the 240 pieces is in turn something between a police sketch and a clear picture. The contours of the piece are created by drawing on knowledge of each industry, each purchaser in that industry, each process operated by each purchaser, valve type preferences, and other factors. For example there are component listings for power plants in the McIlvaine’s 42EI Utility Tracking System.
|
Knife Gate Valves supplier:
|
ITT
|
|
startup
|
plant name
|
unit id
|
utility name
|
state
|
reagent
|
process
|
size MW
|
|
2006
|
Mitchell-AEP
|
2
|
American Electric Power
|
WV
|
limestone
|
wet
|
816.3
|
|
2007
|
Mitchell-AEP
|
1
|
American Electric Power
|
WV
|
limestone
|
wet
|
816
|
|
2008
|
Mountaineer
|
1
|
American Electric Power
|
WV
|
limestone
|
wet
|
1300
|
Case histories and bidder specifications are provided in the valve intelligence system which is part of N028 Industrial Valves: World Market.
Since many valve supplier decisions rest on assumptions about the market and market share it is well worthwhile to invest in market share analyses even if it is only the equivalent of a police sketch. The more accurate analysis can be part of a program which also tracks purchases by each major prospect.
For more information contact Bob McIlvaine at rmcilvaine@mcilvainecompany.com 847 784 0012 ext. 122.
|