
Global View
The global chemical
industry had a very good year in 2010, Chemical & Engineering News states in its
Facts and Figures Report. Late 2009 saw customers finally starting to put in
orders again, after depleting inventory stocks.
Rather than comparing individual company performance with that of 2009, most
firms were tracking sales on a quarter-to-quarter basis during 2010. Selling
more electronic and performance materials was a positive sign, but it took the
full year before demand picked up for other chemical products.
Costs were continues to be controlled, however, most of the large cost-cutting
programs wound down in early 2010. In conference calls with analysts, chief
executive officers said that productivity improvements would allow them to
increase output without hiring workers or building new plants. Indeed, capital
spending and hiring were stagnant at most firms. Many firms did renew funding
for research and development, however.
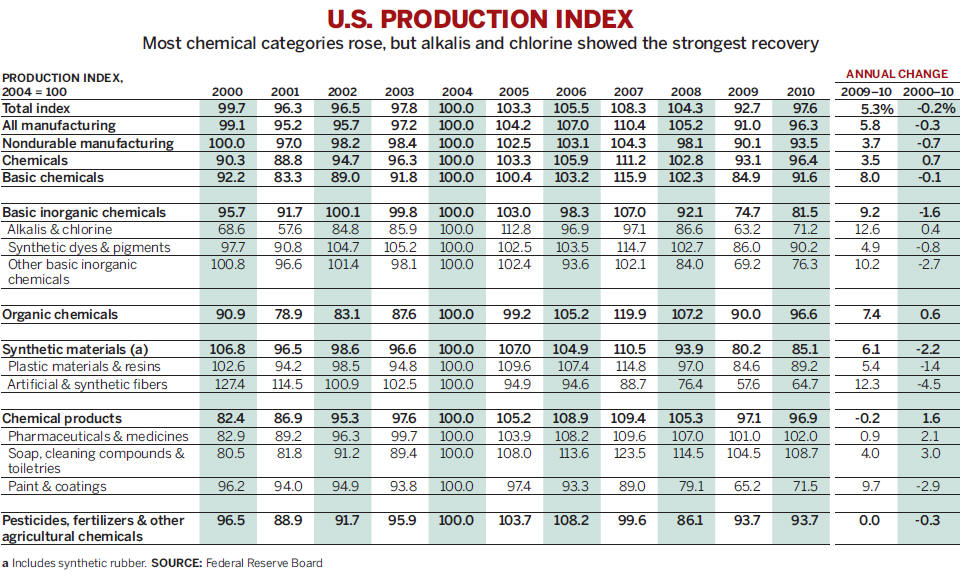
Chemical production was up for almost all categories of chemicals in the U.S.,
Canada, Japan, South Korea, Taiwan, and China. By the end of 2010, chemical
production had increased at rates ranging from 3.5% for the U.S. to 11.1% for
Taiwan. Still, it was not enough to make up for the significant drop in
manufacturing that occurred in 2008–09. For the U.S., Canada, Western Europe,
and Japan, meeting or surpassing the boom levels of 2007 will take many years.
Meanwhile, chemical firms in South Korea and Taiwan are increasing production
and exports at comparatively faster rates.
Proximity to China may explain why production indexes showed that growth in chemicals was stronger in Asia than in the U.S. and Canada. Japan upped its output of all chemicals by 9.0% in 2010 compared with 2009. In South Korea the increase was 6.8%, and in Taiwan it was 9.0%.
The increase in
demand for chemicals, especially from economies growing faster than the U.S.
economy, helped power a near-doubling of the U.S. chemical trade surplus to
$15.6 billion. In particular, the U.S. enjoyed a growing plastics surplus, and
it shrank its trade deficit in organic chemical products in 2010 compared with
2009.
Trade with the developing world also boosted exports from Europe. On the plus
side were European shipments to Brazil, China, India, and Russia, all of which
grew by more than 20% in 2010. On the import side, Europe’s imports of chemical
Additionally, the U.S. and Europe significantly increased chemical exports to
developing nations such as China and Brazil in 2010.
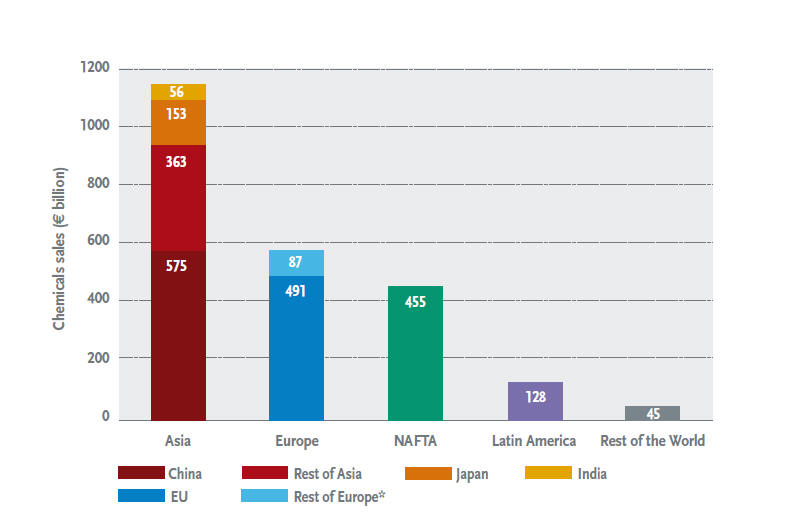
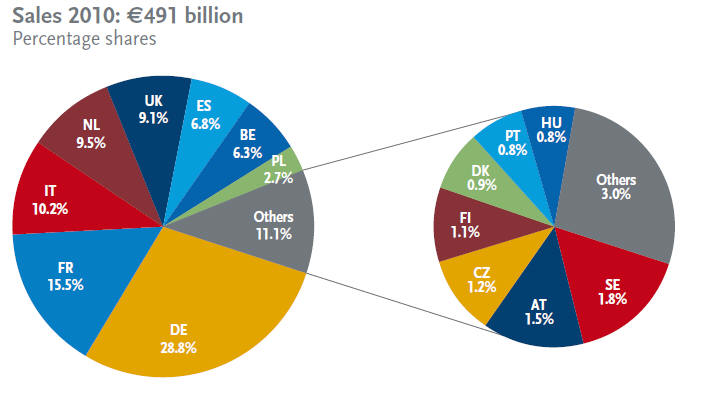
According to the latest CEFIC (The European Chemical Industry Council) Facts & Figures Report, world chemicals sales in 2010 were valued at €2353 billion. Asian chemical production equals that of Europe plus America.
2010 World Chemical Sales €2353 billion
Source: Cefic Chemdata International
* Rest of Europe = Switzerland, Norway and other Central & Eastern Europe (excluding the new EU 12 countries)
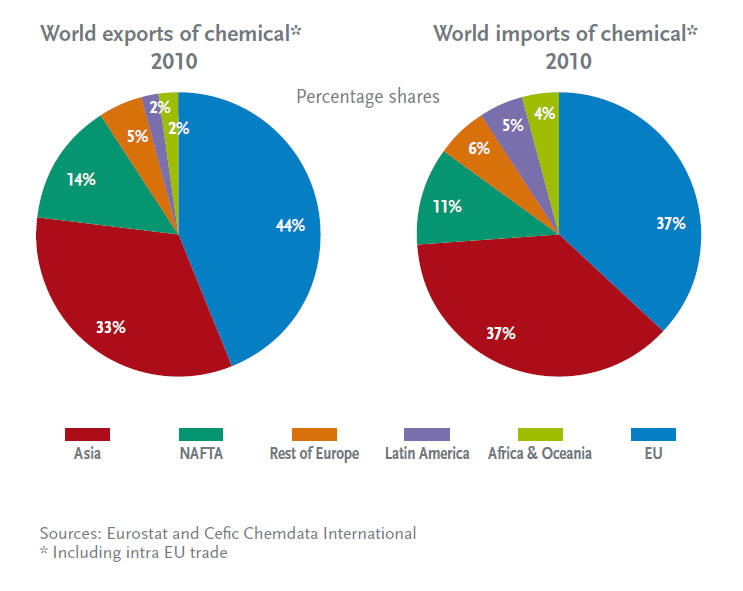
The European Union is the world’s top exporter and importer of chemicals.
In the U.S., overall chemical output was up 3.5% in 2010. to reach 2007
production levels, according to the
Chemical & Engineering News Facts and Figures Report.
Another 15.5% of improvements in production would be needed and that will likely
take many years.
Domestically, chemical production volumes have increased across all regions of the United States in 2010 following steep declines in 2008 and 2009. The largest gains have occurred in the Gulf Coast and Ohio Valley regions, boosted by export demand for basic chemicals and plastics. Output is expected to grow moderately in all regions in 2011 and continue to improve through 2012.
U.S. output shot up for aniline, benzene, 1,3-butadiene, and cumene, all of
which grew at double-digit rates. For inorganics, all but ammonium nitrate,
hydrochloric and phosphoric acid grew more than 10% compared with 2009. Among
plastics, production of PVC and copolymers grew at just under 10%. And even
nylon, olefin, and polyester fibers turned around a decadelong slide.
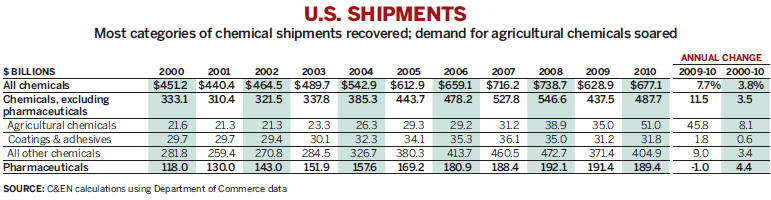
For 2010, U.S. chemistry exports will be up by 17%, shifting the trade balance
for the industry from a $0.1 billion deficit to a $3.7 billion surplus, its best
performance in 10 years. The growth in export markets also has partially offset
soft domestic demand for the products of chemistry.
The $674 billion American chemistry enterprise accounts for more than 10% of
U.S. exports and provides approximately 780,000 jobs in the United States.
Growth in export markets is driven by several factors, including favorable
energy costs, resulting from developments in extracting natural gas from shale;
and growth in emerging markets, where recovery, and now expansion, has been
strongest.
“Shale gas extraction has been a ‘game changer’ for America’s chemical
manufacturers, enabling us to remain highly competitive in a global market,”
Dooley said. “We want to ensure that the appropriate regulatory policies are in
place to capitalize on this energy source, while ensuring protection of our
water supplies and the environment.”
Growth in emerging markets, most notably in China, India, and Brazil, is
increasing demand for chemistry feedstock materials. Production of chemistry
products in emerging economies increased by 12.2% in 2010, and further gains are
expected. During 2011, as emerging nations continue to present good growth
prospects, trade in chemicals will continue to expand.
U.S.Historical Data
The following charts shows U.S. Chemical Industry statistics for 1998-2008.

Sources: US Department of Commerce (Domestic Exports), American Chemistry Council analysis

Sources: US Department of Commerce (General Imports), American Chemistry Council analysis

Source: American Chemistry Council analysis
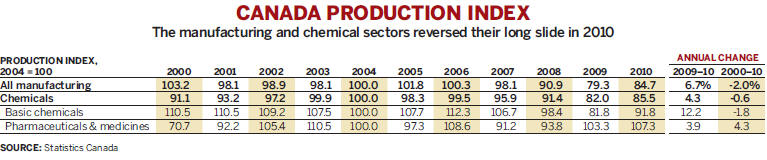
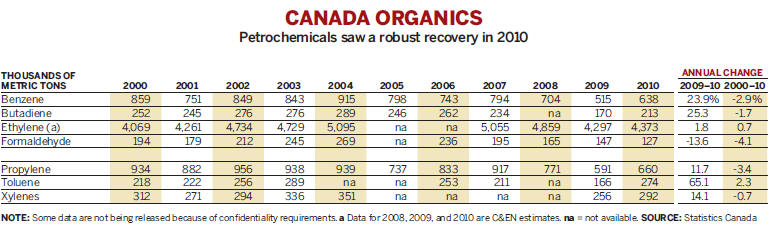
In Canada, plant output grew 4.3 percent from 2009, with production up is almost
all areas. Petrochemicals saw a robust recovery, with toulene increasing 65
percent, butadiene and benzene up 25 and almost 24 percent respectively.
Canada Historical Data
Canadian chemicals and chemical products industry principal statistics, 2000-2009
| Year | Establishments |
Shipments ($ billions) |
Employment |
Imports ($ billions) |
Exports ($ billions) |
|---|---|---|---|---|---|
| 2000 | 2061 | 37.16 | 83 252 | 29.17 | 18.61 |
| 2001 | 2067 | 38.41 | 87 861 | 31.08 | 19.84 |
| 2002 | 2145 | 40.52 | 88 129 | 32.93 | 20.21 |
| 2003 | 2122 | 42.69 | 87 166 | 33.28 | 20.40 |
| 2004 | 3315 | 47.16 | 84 091 | 35.57 | 24.29 |
| 2005 | 3049 | 48.64 | 81 882 | 37.40 | 26.86 |
| 2006 | 2955 | 49.89 | 79 990 | 39.35 | 28.93 |
| 2007 | 2945 | 48.63 | 78 709 | 40.42 | 32.33 |
| 2008 | 29451 | 50.621 | 78 6301 | 42.10 | 31.39 |
| 2009 | 29451 | 42.471 | 71 4001 | 39.76 | 26.51 |
1 Industry Canada estimates
Source: Statistics Canada
Note: Principal Statistics — The step changes in
establishments observed in 2000 and 2004 were due to changes by Statistics
Canada in the minimum threshold size necessary for inclusion of establishments
in the annual data. These changes had only minor impacts on other principal
statistics.
The Cefic European Facts & Figures provides an analysis of the European chemicals industry. The output of the chemical industry, which includes all 27 EU member states, covers a wide range of chemical products and supplies virtually all sectors of the economy. The industry also provides a significant contribution to EU net exports.
In 2010 the EU Chemical sector produced 21 percent of the world’s chemicals, excluding pharmaceuticals. Eight countries account for 90 percent of European chemical production. Germany is the largest producer, followed by France.
Click Here for Facts and Figures 2011: The European Chemical Industry in a Worldwide Perspective.
China's chemical industry is the largest in the world in terms of output value, an article in Chemical Week reported. The China Petroleum and Chemical Industry Federation (CPCEF) states that the value of the chemical industry output in China, excluding pharmaceuticals, increased 32.6 percent in 2010 to over $818 billion, compared with 2009. China now accounts for 25 percent of global chemical shipments, excluding pharmaceuticals. Chemicals account for 10 percent of Chinese GDP, compared with about five percent in the U.S. The industry is growing in China. Several factors will contribute to this growth, including an increase in public housing projects, the development of western China, and infrastructure investment in power, railways and water treatment.
Multinational chemical companies are accelerating plans to expand Chinese operations. BASF has a huge presence in China and anticipates rapid growth, catering to various industries including construction, automotive, packaging and paint and coatings. Dow Chemical expects China to become the company's largest market, and is looking at mergers and acquisitions, including a previously announced $10 billion coal to chemicals JV project with coal mining company Shenhua Group.
China is a major importer of chemicals, and it had an $18.1 billion overall trade deficit in chemicals in 2010, per the Chemical & Engineering News Facts and Figures Report. Most of that gap was due to a shortfall in organic chemicals worth $16.5 billion. China’s fertilizer surplus was $2.9 billion.
In Asia, production of acrylonitrile, benzene, and purified terephthalic acid
increased almost 10%. In Japan, production of hydrogen peroxide and nitrogen
soared 23.4% and 16.5%, respectively. But Japan has slid to third place in the
production of the building block chemical ethylene, after South Korea and China.
China expanded its output of methanol, which it produces from abundant coal reserves, by 38.9%. Japan, South Korea, and Taiwan all boosted manufacturing of plastics, especially polypropylene in Japan, polystyrene in South Korea, and acrylonitrile-butadiene-styrene in Taiwan.