Cost Structure
Future Prices of Natural Gas by Region
There are no lack of forecasts for the future price of
natural gas for the various regions of the world. The problem is that these
forecasts range widely. We have selected "The Role of LNG in North American
Natural Gas Supply and Demand as a basis for our analysis
http--www.beg.utexas.edu-energyecon-lng-documents-CEE_Role_of_LNG_in_Nat_Gas_Supply_Demand_Final.pdf
This Center for Energy Economics document was prepared in 2004 and issued in September of that year. Presently, the price of natural gas has reached unprecedented heights in the U.S. Unexpected shortages have been experienced elsewhere. Argentina needs more of the gas it extracts and is cutting the supply to Chile.
One of the biggest problems in determining the future prices is the demand variable. North America consumes a huge portion of the natural gas produced worldwide. If other countries continue to increase their consumption prices will escalate sharply.
But as the price goes up demand slackens. The U.S. consumption would be far greater if many industries had not closed down their U.S. plants and moved to locations with cheap gas. So demand is elastic.
Ultimately the cost of coal gasification, coal liquefaction, and similar technologies may set the price of natural gas.
To make LNG available for use in energy consuming countries like the
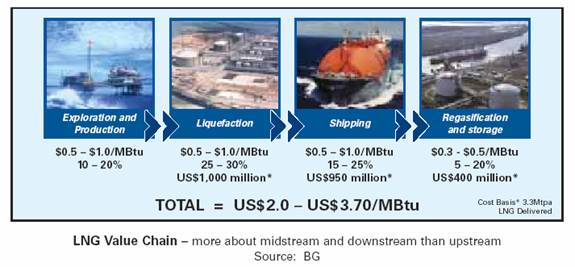
U.S., Japan, South Korea etc., investment is required in a number of different operations that are highly interlinked and dependent upon one another. This global LNG business is described as the “LNG Value Chain”. The major links of this chain, excluding pipeline operations, consist of the following:
Exploration and Production; of the natural gas for delivery to gas users as sales/LNG feed gas.
Liquefaction; conversion of the delivered feed gas into a liquid state (LNG) for transportation.
Shipping; the LNG in special purpose vessels.
Storage and Regasification; convert LNG stored in specially made storage tanks, from the liquefied phase to the gaseous phase for transportation by pipeline to the energy markets.
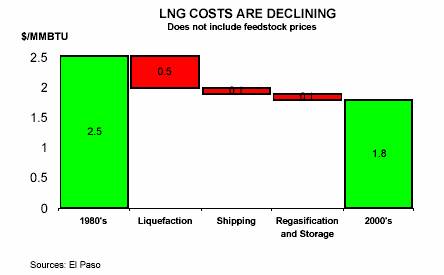
Each of these links has its own set of technology challenges and investment criteria, but each is linked to the others in the sense that no one component is a viable business investment without the other. The diagram below describes simplistically the links of the “LNG Value Chain” and typical value of each link.
The enormous investment required particularly in the liquefaction and shipping components have historically made the careful assembly of this chain a prerequisite for each LNG project; from the delineation and dedication of the natural gas reserves on the upstream of the chain, to the guarantee of long-term (20/25years) markets on the downstream end.
The cost of the LNG Value Chain is such that economics of scale matter! The trend being for larger liquefaction plants and larger LNG carriers traveling longer distances at
a lower delivery cost per MBtu (Million British thermal unit).
Exploration and production costs have been declining due to improved technologies such as 3-D (three-dimensional) seismic; drilling and completion of complex well architectures and improved subsea facilities. 3-D seismic allows detailed complex imaging of rocks below the earth’s surface, enabling exploration earth scientists to predict better where accumulations of natural gas might exist. Drilling and completion of complex well architectures allow petroleum engineers to target more precisely these accumulations and to maximize oil and gas reservoir recovery using multi-branched well architecture and intelligent completion systems. Improved sub-sea facilities allow companies to produce natural gas from deep below the surface of the ocean.
Investment in exploration and gas field production will require an investment of $53 billion per year for the next 30 years to ensure that natural gas resources reserves outpace the demand.
Further along the LNG value chain, technical innovations have also reduced the costs of LNG liquefaction and shipping allowing more LNG projects to achieve commercial viability.
Liquefaction costs have been lowered by as much as 35% because of the introduction of competing technologies and economies of scale. As LNG facilities get larger, owners keep looking for ways to lower costs by benefiting from economies of scale. As export capacity grows, owners tend to have fewer concerns over maximal LNG train size, especially when the design concept includes a “two-train-in-one” reliability concept that allows the LNG train to operate at about 60% to 80% capacity even with one of the gas turbine driven refrigerant compressors out of action.
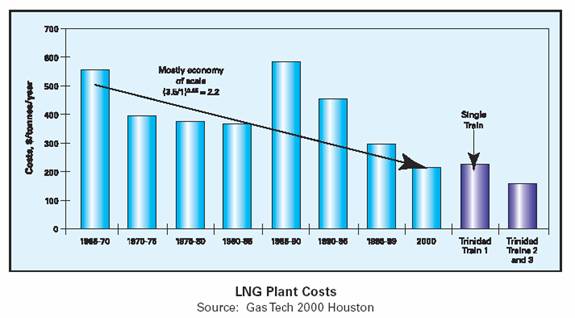
The outstanding safety, reliability, and high operating factors of the LNG industry build up confidence in larger trains. Design efficiencies and technology improvements have all contributed to improved project economics. BP’s Trinidad LNG Train 1, completed in June 1999, set a new benchmark for LNG unit plant capital cost at less than $200/tonne of annual plant capacity, as detailed above in LNG Plant Costs.
Trinidad Atlantic Train 2 was completed in August 2002; Train 3, was completed in the second quarter of 2003. The capital cost of Trains 2 and 3 is expected to be about $165/tonne of capacity with Train 4 being even lower having a larger capacity of 5.2 Mtpa at $140/tonne of capacity in 2007.
The key factors which accounted for the continuing reduction and projected trends in lower LNG unit plant capital costs are:-
APCI propane pre-cooled MCR process vs. ConocoPhillips optimized cascade process – competition among technologies.
Duel-mixed refrigerant process (replacing propane cycle)
GE Frame 7 (80 MW) single shaft gas turbines
GE Frame 9 (110 MW) single shaft gas turbines couple with axial high flow rate compressors
Aero derivative turbines as an alternative to industrial ones
Efficient heat recovery systems from gas turbines
High-efficient, low emission, direct-drive electric motors coupled to axial compressors electric power connection required as proposed in Norway
Aluminum spool-wound main cryogenic heat exchangers
Larger single train capacity vs. 2 x 50% trains will allow short project schedules; smaller plot plan and simpler design.
Floating production; liquefaction; storage and re-gasification units or combination of one or the other.
With the development of longer LNG chains and transportation from ever more remote destinations, shipping accounts for an increasing share of LNG industry capital expenditure and operating costs. In addition, managing transportation creates value, since companies can redirect ships to take advantage of regional price differences through arbitrage transactions, which are growing rapidly.
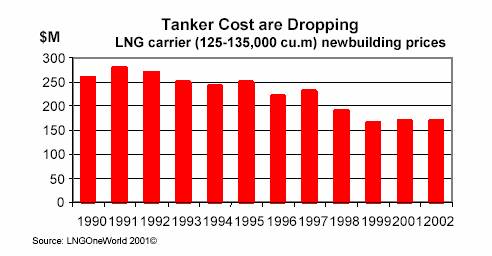
The technical requirements of safely transporting large amounts of liquefied gas at very low temperatures are significant. In particular, efficient insulation is required to prevent the LNG from warming up and to protect the adjacent structures from “overchilling”. As a result, only around ten shipyards worldwide are capable of building LNG carriers, which cost between $150 million and $200 million, making them the most expensive vessels in the world.
Transportation capacity is growing fast, with a world fleet of 175 carriers in operation and over 100 on order at end-2005. The price of vessels has declined sharply to around $1,000m3 of capacity over the last ten years, driven by competition from the biggest South Korean shipyards and by larger LNG carrier size, which has risen from 145,000m3 to 200,000 m3.
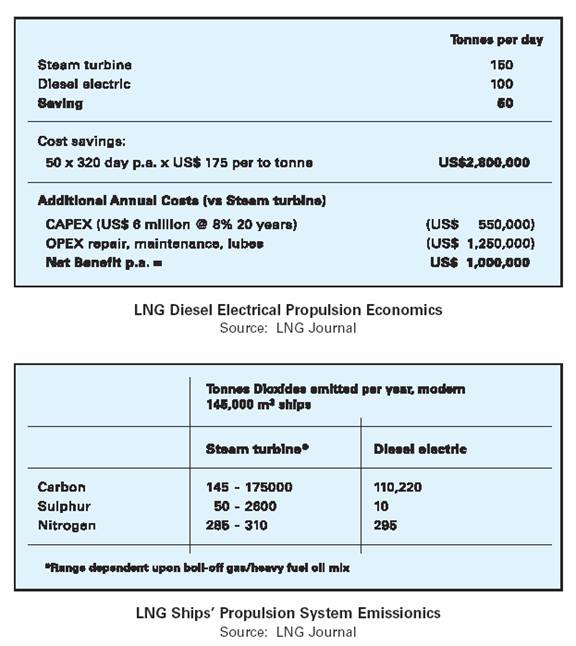
In ship design, new technologies are also helping to reduce costs. New propulsion systems are aimed to replace the traditional steam turbine engines with diesel electric ones that are more efficient. This will not only reduce fuel costs but will also increase cargo carrying capacity and reduce carbon, sulfur and nitrogen emissions as detailed in the following tables.
Regasification is in fact an onshore gas receiving terminal and a critical segment of the LNG value chain representing 5% to 20%, depending on size and location of the total cost of the chain. The site for a receiving terminal has to meet a variety of criteria that include safety and availability of access to the sea, proximity of gas distribution grids, consumer areas, and sufficient space to maintain an adequate safety distance from inhabited areas and other human activities.
The terminal also has to respect the natural environment and be accepted by neighbors in terms of its impact on local activities and the landscape. Since fewer and fewer sites offer this combination, operators are developing new concepts to meet all the requirements. Those considered include offshore installations, often the only appropriate solutions in some situations.
The capital cost breakdown for a receiving LNG terminal is difficult to assess since each terminal is different and costs vary widely depending on location, site conditions, plant design and the type of equipment specified. As a rule of thumb, LNG storage is equal to at least a single tanker cargo plus a typical 135,000m3 regasification plant cost at $400 million. This being in the region of US$0.3 – 0.5 per MMBtu. The cost break down of the terminal being:
Cryogenic Storage in one tank – 25%
Vaporization and compression – 35%
Marine jetty – 15%
Miscellaneous – 25%
Considerations affecting capital costs include:
Site Selection
Storage capacity and type
Nitrogen content
Boil – off gas recovery
Heat source for vaporization
Power source
Technological improvements in combination with economies of scale promise to reduce the capital cost of each element in the LNG value chain (liquefaction, shipping and regasification) beyond the reductions that have already been realized.
New
liquefaction process technology will see train sizes of nearly 8 million tonnes/year
being installed.
Largest LNG carriers will take a leap in size to 216,000
m3
of capacity from today’s
present 145,000m3. Super large LNG carriers as large as
260,000m3 are being planned
to service new projects in Qatar.
Enhanced
tanker efficiencies – longer operating lives, improved safety technology and
improved fuel efficiency – have lowered shipping costs substantially. Shipyard
expansions in the
Far East and
increased competition among shipbuilders have lowered
LNG tanker costs by 40
percent from their peak.
Competition among builders also is driving down costs for new regasification plants. Regasification costs have fallen about 18 percent. The result of all these improvements is that the overall cost of LNG delivery has been reduced by almost 30 percent during the last 20 years.
5-8080-8585-9090-95TrinidadTrain 1Trinidad Trains 2 and 395-99‘00$ /: BP
The decline in costs and the general growth in LNG trade should allow natural gas to play an increasingly larger role in meeting U.S. energy demand. Today, LNG competes with pipeline gas in the North American and European markets, creating the benefits of competitive pricing for consumers, and it competes against other forms of energy like oil in Asian markets.