Coronavirus Technology Solutions
September 14, 2020
AMC Theaters Open with MERV 13 Filters
Cloth and Surgical Masks Not Sufficient to Protect Against Wildfire Smoke
Air Pollution Levels in the Western U.S. are Alarming
FT Reporters Use Pocket Monitor to Document High Levels of Pollution in Our Daily Lives
Loss of Life Expectancy is a Useful Tool to Assess the Air Pollution, COVID Combined Risk
Value Rating for Masks and Filters Using LEE
_____________________________________________________________________________
AMC Theaters Open with MERV 13 Filters
One million people have attended AMC theaters since they started reopening last month. One hundred theaters were opened initially but by October 75 percent of the 636 theaters will be open. The theaters have upgraded to MERV 13 filters which they claim are four times more efficient than the filters in place. They are using electrostatically charged spray cleaning.
Cloth and Surgical Masks Not Sufficient to Protect Against Wildfire Smoke
Wildfire smoke and COVID particles are in the same size ranges. This Seattle Times article sends conflicting messages by pointing out that you need N95 level efficiency for wood smoke but stating that those masks should be reserved for healthcare workers.
Homemade cotton masks and even surgical masks, which are now commonplace and required in many public places, don’t protect against wildfire smoke.
While the woven fabric can block the aerosols that carry the coronavirus, tiny soot particles can still pass through, UW Medicine pulmonologist Dr. Cora Sack told The Seattle Times this week.
“What we really worry about in wood smoke are those small particles, which, when inhaled, have the ability to get deeper into the lungs,” Sack said.
The effects of COVID-19 and wildfire smoke overlap. Both woodsmoke and COVID-19 can harm the immune and respiratory systems.
“Stay indoors and keep your indoor air clean,” said Lacy Fehrenbach, deputy secretary of health for COVID-19 response for the state health department. “When the air is fresh, open your windows.”
N95 respirators that fit properly do prevent fine particles from passing through, but health officials say that equipment should continue to be reserved for health care workers because it’s the most effective option for protecting against aerosol transmission of the virus that causes COVID-19 in medical settings.
Air Pollution Levels in the Western U.S. are Alarming
The blanket of smoke which many have taken to social media to describe as "apocalyptic" has grown so large that it is easy to see from space, stretching all along coast of the western U.S. and expanding more than 1,000 miles westward over the open waters of the Pacific Ocean.
The far-reaching effects of the wildfire smoke have done more than just block out the sun. The plethora of smoke has caused air pollution to spike across the region all the way from San Diego to Seattle, with the worst pollution levels focused on Northern California and western Oregon, where the largest fires are burning.
The air pollution in this area is approaching the worst levels in years, according to Plume Labs, a company that monitors air pollution around the globe.
In the past five years, the highest air pollution levels were observed in Palmdale, California, just north of Los Angeles, during December of 2017, Plume Labs said. Currently, the air pollution levels just north of San Francisco are just as bad.
Across the border in Oregon, the air pollution along the Interstate 5 corridor is a ‘hazardous' levels, including Medford, Eugene, Salem and Portland.
"Wildfire smoke exposure can have very real health consequences. The most common health risks associated with smoke exposure are found within our lungs," Plume Labs told AccuWeather.
"Smoke exposure can lead to difficulty with breathing, including coughing, runny nose, bronchitis, wheezing and exacerbation of chronic diseases such as asthma and chronic obstructive pulmonary disease (COPD)," the company added.
Health effects may be exacerbated if you have heart or lung disease, are an older adult or a child, are pregnant, are a smoker or are involved in strenuous outdoor work or outdoor sports, Plume Labs said.
The air pollution that has enveloped the western U.S. is much different than other types of air pollution, such as smog that is produced by factories.
"Wildfires emit a mixture of particulate matter (PM) and gases," said Dr. Boris Quennehen, a scientist a Plume Labs. "In particular, forest fires emit significantly more pollutants, mostly because they last longer. Even variations of wood and how it is burning can make a difference."
FT Reporters Use Pocket Monitor to Document High Levels of Pollution in Our Daily Lives
Globally, some seven million deaths each year are linked to the effects of air pollution, according to the World Health Organization, making it the biggest environmental killer. Pollution kills more people than car accidents, diabetes or dementia. One source estimates that it reduces the average life span by two years. The effects are particularly pronounced for children, who can experience stunted lungs and lifelong cognitive impacts. But how bad, really, is the air we breathe? What does air pollution, often presented in abstract statistics, feel like in daily life? Can people in cities wrest any control over the level of pollution they experience? To answer these questions, the Financial Times asked correspondents in five cities — Beijing, Lagos, London, New York and São Paulo — to carry a personal pollution monitor for one to two weeks and record the results.
The device, the Flow pollution monitor made by Plume Labs, takes measurements once a minute for four types of pollutants and uses location data to create a map of the user’s journey. The device also identifies which types of pollution are worst at any given moment, recording the levels of small particulate matter (PM2.5), larger particulate matter (PM10), nitrogen dioxide and volatile organic compounds (VOCs). Air pollution is not a single substance — many types of molecules and particles combine to create unhealthy air and generate new pollution through chemical reactions.
All five correspondents experienced “very high” pollution levels more than once. The FT Beijing writer recorded the most severe pollution on average; São Paulo was the cleanest city in the set. Sometimes pollution came from unexpected places — the New York reporter discovered that restaurant kitchens and indoor chemicals were a big source of contaminants. Of course, people have lived with some degree of air pollution for a long time. Even indoor fires for cooking or warmth create hazardous pollution. But during the 20th century the rise of the car and the use of fossil fuels made outdoor pollution in cities an increasing concern.
The problem went beyond just vehicles: there were episodes of moderate air pollution all across southern England on several days, Agricultural pollution is worst during spring. When farmers spread slurry on their fields, it generates ammonia that mixes with other chemicals to form harmful particles.
The London FT reporter said “The biggest surprise came when I hopped on the underground: the air on the Tube was terrible, and the five underground trips I made while carrying the Flow device generated the worst pollution readings I experienced anywhere. Although nitrogen dioxide was low, the presence of dust, soot and particles produced by train brakes all contributed to high levels of particulate matter.”
https://www.ft.com/content/7d54cfb8-cea5-11e9-b018-ca4456540ea6
Loss of Life Expectancy is a Useful Tool to Assess the Air Pollution, COVID Combined Risk
One way of expressing quantified risk is the loss of life expectancy (LLE); i.e., the average amount by which one's life is shortened by the risk under consideration. The LLE is the product of the probability for a risk to cause death and the consequences in terms of lost life expectancy if it does cause death. As an example, statistics indicate that an average 40-year-old person will live another 37.3 years, so if that person takes a risk that has a 1% chance of being immediately fatal, it causes an LLE of 0.373 years (0.01 x 37.3).
It should be clear that this does not mean that he will die 0.373 years sooner as a result of taking this risk. But if 1,000 people his age took this risk, 10 might die immediately, having their lives shortened by 37.3 years, while the other 990 would not have their lives shortened at all. Hence, the average lost lifetime for the 1,000 people would be 0.373 years. This is the LLE from that risk.
One widely recognized risk is cigarette smoking. One pack per day has an LLE of 6.4 years for men and 2.3 years for women — in the former case, this corresponds to an LLE of 10 minutes for each cigarette smoked.
The LLE from being sent to Vietnam during the war there was 2.0 years in the Marines, 1.1 years in the Army, 0.5 years in the Navy, and 0.28 years in the Air Force.
The LLE from all accidents combined is 435 days (1.2 years). Almost half of them involve motor vehicles, which give us an LLE of 180 days — 147 days while riding and 33 days as pedestrians. Using a small car rather than a large car roughly doubles one's risk, and this would be true even if everyone used small cars. The difference between using a small and a midsize car is an LLE of 60 days,
Reducing the national speed limit from 65 to 55 miles per hour in 1974 increased our life expectancy by 40 days, and the recent increase back to 65 miles per hour on interstate highways in some states has had a substantial reverse effect.
On an average, riding one mile in an automobile and crossing a street each have an LLE of 0.4 minutes, making them as dangerous as one puff on a cigarette (assuming 25 puffs to a cigarette), or, for an overweight person to eat three extra calories. Note that if walking involves crossing a street more often than once per mile, it is more dangerous to walk a mile than to drive a mile.
Other things some of us use are much more harmful. Alcohol abuse is estimated to cause 100,000 deaths per year due to cirrhosis of the liver, psychosis, accidents, suicides, and homicides, giving the average American an LLE of 230 days. Abuse of other addictive substances is estimated to cause 35,000 deaths per year, corresponding to an LLE of 100 days averaged over the population. Of course, the LLE is much larger than these averages for those who indulge and much less for those who do not. However, it is still substantial for the latter group, as they are often victims of homicides and of automobile collisions with drunk drivers.
Football seems like a dangerous sport, but the risk of being killed per year of participation is only 1 in 81,000 in high school and 1 in 33,000 in college, corresponding to LLE of 0.3 and 0.6 days, respectively. Many other sports are much more dangerous. The LLE per year of participation is 8 days for professional boxing, 25 days for hang gliding, 110 days for dedicated mountain climbers (10 days for all climbers), 0.9 days for mountain hikers, 25 days for parachuting, 9 days for sailplaning, 7 days for amateur scuba diving, 2 days for snowmobiling, and 0.5 days for racing on skis.
To put this in perspective lets assume a risky behavior creates a 5% of contracting COVID and a 0.05 chance of dying for just one event such as attending a large superspreading event. If the individual would lose 40 years of remaining life the LLE will be 700 days but if he repeats this behavior 10 times the LEE would be 7,000. This is in contrast to the average individual avoiding these risks and generating an LEE of 1800. However, this assumes the COVID risk remains constant. If it is a one-year event the LEE drops to 25. If COVID, new viruses, and influenza deaths in the future average three times the present influenza, pneumonia LEE it would be 390.
LOSS OF LIFE EXPECTANCY (LLE) DUE TO VARIOUS RISKS
|
TABLE 1 |
|
||
|
Activity or risk* |
LLE (days) |
|
|
|
Cigarettes (male) |
2300 |
|
|
|
|
COVID based on continuity |
1800 |
|
|
|
Air Pollution latest finding |
700 |
|
|
15-lb overweight |
450 |
|
|
|
All accidents* |
400 |
|
|
|
Vietnam army service |
400 |
|
|
|
|
COVID, influenza and viruses |
390 |
|
|
Alcohol* |
230 |
|
|
|
Motor vehicle accidents |
180 |
|
|
|
Pneumonia, influenza* |
130 |
|
|
|
Drug abuse* older finding, now higher |
100 |
|
|
|
Suicide* |
95 |
|
|
|
Homicide* |
90 |
|
|
|
Air pollution original finding |
80 |
|
|
|
Small cars (vs. midsize) |
60 |
|
|
|
Married to smoker |
50 |
|
|
|
Drowning* |
40 |
|
|
|
Speed limit: 65 vs. 55 miles per hour* |
40 |
|
|
|
Coffee: 2 cups/day |
26 |
|
|
|
COVID as one-year event |
25 |
|
|
|
Firearms* |
11 |
|
|
|
Peanut butter (1 Tbsp./day) |
1.1 |
|
|
|
Airline crashes* |
1 |
|
|
There are 30,000 deaths in the U.S. per year from automobile accidents. the number of Coronavirus deaths in the U.S. will be somewhere between 200,000 and 400,000. So coranvirus deaths will be at least 10 x those of motor vehicles. So, this moves COVID up to 1800 LLE if this were to be a yearly total for life. If this is just a one-year event and no similar viruses take lives in future years it would only be an LLE of 25
If one assumes that COVID, new viruses and influenza eventually are reduced to a rate triple the present pneumonia rate the LLE will be 390
Value Rating for Masks and Filters Using LEE
Use of H 13 filters and N95 masks are justified based on preliminary use of a value rating system being compiled by the McIlvaine company. It is based on the net value which is the value reduced by the percent effectiveness and applicability and then further reduced by the economic and life quality cost.
|
Factor |
Description |
|
Value |
Lives saved, sickness averted, life quality costs avoided |
|
Effectiveness |
Efficiency of the device in removing the virus |
|
Applicability (virus load) |
The percentage of the virus load which will enter device |
|
Economic Cost |
Capital and operating cost of the device as a % of value |
|
Life Quality Cost |
Life Quality Costs as measured by QELD |
|
Net Value |
Percentage of total value remaining after reductions |
The following example was presented in a McIlvaine webinar conducted on September 10. It can be viewed at
To view this YouTube recording click here: https://youtu.be/kmtLmYYLuqw
To view PowerPoint Slides Click here: http://home.mcilvainecompany.com/images/Air_Filter_Webinar_2020-09-10.pdf
The webinar provides considerable analysis of effectiveness and applicability. It did not focus on the total value.
|
Product |
Effect- |
High |
50% |
25% |
Econ |
Life |
Net |
Net |
Net |
|
H13 |
99 |
80 |
40 |
20 |
16 |
0 |
63 |
23 |
4 |
|
MERV 16 + |
90 |
80 |
40 |
20 |
15 |
0 |
57 |
17 |
3 |
|
MERV 13 + |
60 |
80 |
40 |
20 |
12 |
0 |
36 |
12 |
0 |
|
MERV 8+ |
40 |
80 |
40 |
20 |
8 |
0 |
24 |
8 |
0 |
|
Net H 13-MERV 8 Differential |
|
|
|
|
|
|
39 |
15 |
4 |
The total value is a function of lives saved, sickness averted as well as life quality costs avoided. Each of these factors is analyzed in depth. In regard to lives saved an additional factor should be considered. Face masks and HVAC filters protect against air pollutants as well as viruses. It is estimated by some researchers that air pollutants reduces life expectancy by two years.
There are a number of studies comparing loss of life expectancy (LEE) due to various causes. It is therefore desirable to include both air pollution and virus protection in evaluation of filter and mask choices.
The most recent research shows an LEE for the average person of 700 days (Air 1). This compares to historical values of only 80 days (Air 2). In the U.S. given the present death rate from COVID the LEE is over 1800. The likelihood is that vaccines and therapies will greatly reduce this rate. On a worldwide basis it is logical to assume that the LEE caused by a combination of viruses including influenza and COVID will be much lower and will be three times the present pneumonia, influenza rate of 130.
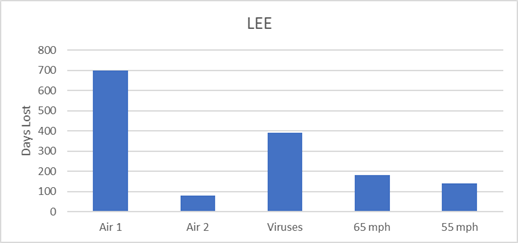
Therefore we are looking at a virus LEE of 390 which is considerably lower than that from air pollution.
McIlvaine had previously determined there was a net value for H13 filters even at low virus loads. If the air pollution benefits are added to this the investment is very worthwhile.
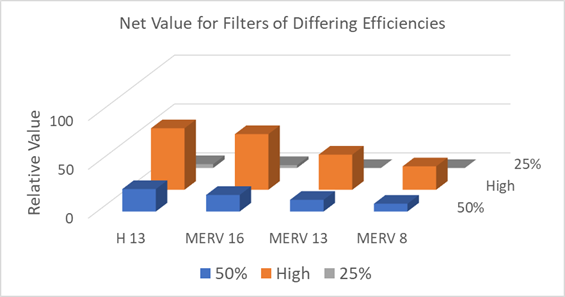
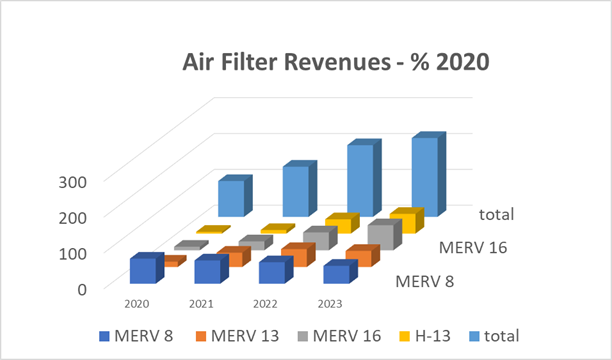
The conclusion is that there is a very big market for higher efficiency filters.
Determining the value is only part of the challenge for suppliers. It is also necessary to convey the benefits to the purchasers. The value rating system is a valuable tool to convey this message. Continuing effort will be needed to make it reliable in each situation.
Suppliers will benefit from the Coronavirus Technology Solutions, Air Filter Market and Supplier Program as well as the Mask Market and Supplier Program described at www.mcilvainecompany.com.