Coronavirus Technology Solutions
August 25, 2020
What will be the demand for Efficient Masks and Filters?
Air Pollution Co-Benefit is Big Reason to Invest in More Efficient Masks and Filters
Periodic Nature of Air Pollution Dictates Flexible Policy
New Low Cost Instruments to Measure Toxic Pollutants can be Utilized for Filter Selection
Quality Enhanced Life Days (QALY) is an Important Tool in Making COVID Technology Investments
COVID Infections With and Without Technology Solutions
Life Quality and Actual Costs of COVID Infections Pegged at $5.5 Trillion per Year
____________________________________________________________________________
What will be the demand for Efficient Masks and Filters?
The selection of mask and air filter efficiency is now influenced by a new parameter which is the quantity of virus emitted through aerosols generated from large droplets landing in filter media. This potential adds to and is consistent with the evidence that airborne transmission is a major cause of COVID-19.
On the plus side more efficient masks and filters save lives, prevent disease, and help people enjoy life better because they feel better.
On the negative side more efficient masks and filters cost more. In the case of filters there is increased energy cost. More efficient masks can be uncomfortable to wear.
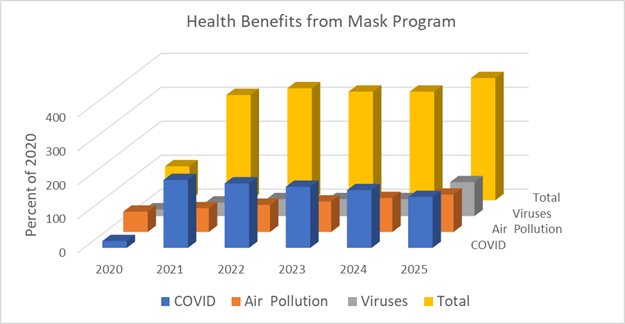
In addition to COVID more efficient masks and filters provide protection against other viruses and air contaminants including both indoor and outdoor generated substances.
The demand for the more efficient products will be a function of the net life quality benefits and the ability of the filtration industry to convey those benefits.
McIlvaine developed an ideal metric (Quality Enhanced Life Days) to determine the net benefits. It was originally used in the hospital industry to help choose between single use and reusable garments.
The concept is simple. People choose life quality over life quantity. Instead of living to 100 as a hermit, they choose to live to 85 and enjoy life. They are applying a 1.18 quality enhancement to every one of the days in this shorter life.
Therefore any net benefit of 1.18 or better will be desired. People voted to increase the speed limit to 65 mph because the few hours of life statistically lost are outweighed by the benefits of shorter trips. By contrast an increase to 120 mph would statistically involve months or years of life lost and would not justify the pleasure of shorter trips.
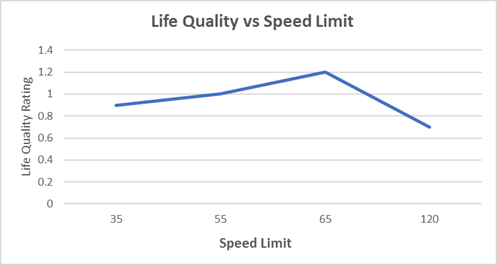
There are cases where a cloth mask can be the 120 mph equivalent compared to N95 which could be as safe as a 55 mph limit. On the other hand wearing an N95 mask while walking through a deserted park may be the equivalent of a 35 mph speed limit.
It may add a few hours to your life but not enough to make it worthwhile. The discomfort would reduce life quality well below the 1.18 threshold. The task for the filtration industry is to communicate the benefits and risks in such a manner that the filter or mask purchaser maximizes life quality in his choices.
Air Pollution Co-Benefit is Big Reason to Invest in More Efficient Masks and Filters
The health benefits of efficient masks based on protection against air pollutants are substantial and should be included in mask decisions. This includes indoor as well as outdoor pollutants.
There is no likelihood of reduction of outdoor air pollutants in the near future. In fact when forest fires are included the need will be growing substantially.
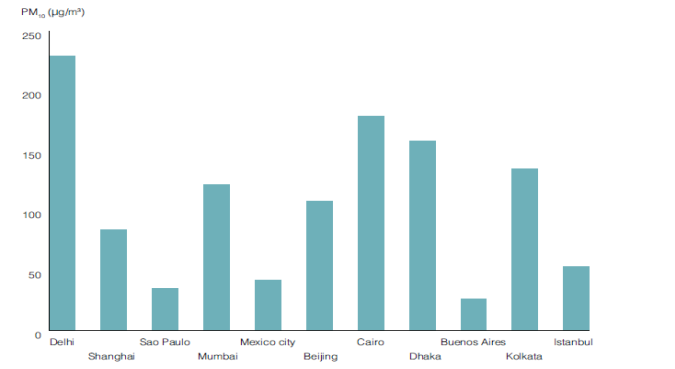
There is an urgent need for more efficient filter and masks in many major cities where ambient PM levels are up to five times greater than the guidelines set by WHO.
PM Levels in Major Cities in 2016
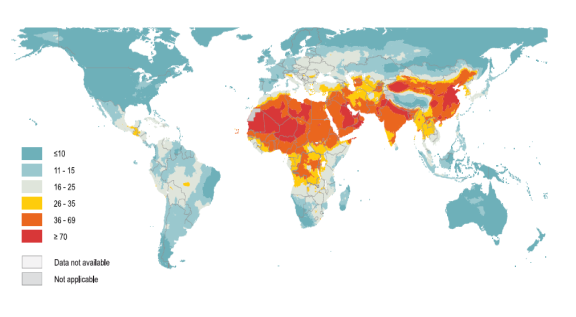
Air pollution causes more deaths in Asia and Africa then elsewhere.
Deaths from Air Pollution per 100,000 Population
Air pollution does not cause sudden death but shortens the life of many people. The years of life lost are labeled Disease Adjusted Life Years.
Disease Adjusted Life Years Lost per 100,000 Population
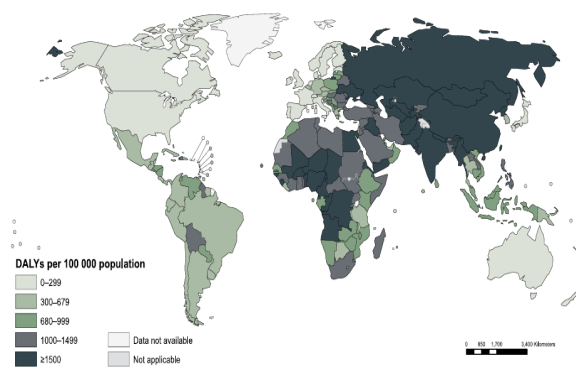
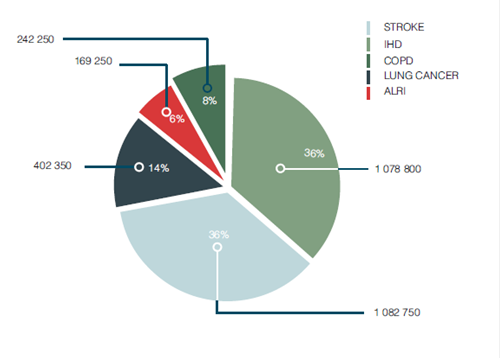
The specific cause of death is by heart attack (COPD), stroke, lung cancer or other illness.
Periodic Nature of Air Pollution Dictates Flexible Policy
In Beijing in the periods of heavy air pollution the sale of N95 masks is much larger compared to cloth masks than it is in other seasons. Citizens are made aware of air quality with electronic indices posted in prominent locations.
Pollution levels vary not only in time but by location and wind direction. This is carried to an extreme with forest fires which are seasonal and with unpredictable locations.
For any specific location and seasonal period the mask choice should be based on the combined risk of COVID, PM, harmful gas, allergens, other viruses and bacteria, and health of the wearer
Offsetting the health benefits are the costs of the filter or mask, the energy consumption for the filter, and the discomfort of wearing the mask.
New Low Cost Instruments to Measure Toxic Pollutants can be Utilized for Filter Selection
New sensors are available to measure specific pollutants including toxic metals. They are less in capital cost and do not require any laboratory expense. This means that every locality can have its own sensors. Furthermore these sensors will measure more pollutants. One big advancement is the ability to measure individual toxic metals.
The CooperXact® 625i monitoring system can simultaneously identify and measure multiple metals in ambient air to provide data for use in applications in cities with periodic toxic metal spikes.
St. Louis undertook a project to assess the value of measuring individual toxic metals.
This investigation featured high time resolution measurements at six sites for periods of nominally one month each. A Cooper Environmental Services (CES) Xact Ambient Air Toxics Monitor (AATM) was used to collect and analyze ambient particulate matter at high time resolution and with sufficient air volume sampled to overcome detection limit issues. Samples were typically collected and analyzed with time resolution of two hours.
The investigation demonstrated the potential for such measurements to identify local emission source bearings that could not otherwise be extracted from the 24-hour average data. The wind direction dependence of arsenic is consistent with a significant contribution from regional transport. Relatively higher arsenic was observed for surface winds from the southeast, and in many cases, this corresponds to synoptic transport from the eastern United States. Local emission source impacts are clearly evident at the Blair NATTS station and include an intermittent emitter northwest of the site. Other features observed in the Blair data are consistent with the four-site filter-based network results, but the low frequency of wind directions from certain sectors precludes a detailed comparison. Most sites show a strong lead signature for winds from the south, consistent with the bearing of the Doe Run Herculaneum lead smelter. This observation is consistent with the results from the four-site filter-based network with the higher time resolution Xact measurements sharpening the relationship between wind direction and high concentration excursions.
If metal toxics data were widely available it would influence mask and filter selection.
Quality Enhanced Life Days (QALY) is an Important Tool in Making COVID Technology Investments
The COVID controversy has demonstrated a need to statistically weigh quality of life versus risk. People do not live their lives to maximize the length. They live to enjoy quality time even at the expense of longevity. Every day we make many quality choices. In fact every minute we spend in an automobile statistically reduces our life by a minute. So if we drive 2 hours for some form of entertainment, we are indicating that we would be willing to sacrifice 2 hours of life for that enhancement. If the risk from contracting COVID at the event is no more than the risk of driving there most people would risk losing a few hours of life. But if the odds show the loss of several years (not hours) then the individual would want to avoid the event.
Sustainability therefore should be about assuring future opportunities for life quality as well as quantity. Success is best measured by a new metric called Quality Enhanced Life Days (QELD).
Quality Adjusted Life Years (QALY) is used widely in healthcare and is typically defined as perfect health years. McIlvaine has supplemented this term with a new term which reflects life enhancement beyond perfect health. A jail inmate may be in perfect physical health and generate one QALY each year. However, the average individual is enjoying life to an extent greater than the jail inmate. This enhancement factor is a key element in decision making.
The average U.S. 35 year old can expect to live 42 additional years while maintaining an average lifestyle. However, with maximum risk avoidance he could be expected to add another 15 years. He would gain these additional years by never traveling or mingling with other people. He would maintain a rigid diet and otherwise follow a course of action to maximize life.
Few would choose to add 15 years in exchange for this monastic lifestyle. The result is that individuals are constantly choosing to take risks that statistically reduce their life in terms of quantity for a perceived increase in quality. These life enhancements are described as Quality Enhanced Life Days (QELD). All sustainability options can be rated in terms of number of QELD gained or lost.
One QELD life enhancement perceived by an individual equal to one day of normal non-enhanced life. If someone would give up two days of normal life for one day of vacation at Disney Land, then each day of his Disney vacation generates one QELD. Most people are functioning based on assumed values of QELD of 1.18. They choose to live a life style which will shorten their life to 80 years rather than the monastic style to live to 95. The metric is explained in the following article.
Quality Enhanced Life Days ~ A New Metric for Hospital ...
This metric has also been used to develop a way to evaluate various different air and water pollutants. This includes lead and arsenic as per the above article. In the following table various pollutants are compared in terms of tons of CO2 equivalent
|
Harm in Tons of Equivalent CO2 |
|
|
Pollutant |
Tons of CO2 Equivalent per Ton Emitted |
|
CO2 (air) |
1 |
|
SO2 (air) |
100 |
|
Mercury (air) |
10,000,000 |
|
Lead |
1,000,000 |
|
Arsenic |
1,000,000 |
|
PM 2.5 |
10,000 |
|
Water usage in drought area |
0.1 |
|
Landfill Depletion |
0.001 |
|
TSS (water) |
100 |
One use of this table is in weighing the extra energy cost of a MERV 16 filter over a MERV 8. There will be a CO2 penalty associated with the MERV 16 selection. But the generation of 10,000 tons of CO2 could be justified to remove one ton of PM 2.5.
COVID Infections With and Without Technology Solutions
It is estimated that about 500 million people or one-third of the world's population became infected with the Spanish flu. The number of deaths was estimated to be at least 50 million worldwide with about 675,000 occurring in the United States. The U.S. death toll from COVID is already at 176,000 and 700,000 globally. So the U.S. is experiencing 25% of the deaths compared to 1.3% in the 2017-18 so called Spanish flu which started in Kansas City and was carried abroad by U.S. soldiers.
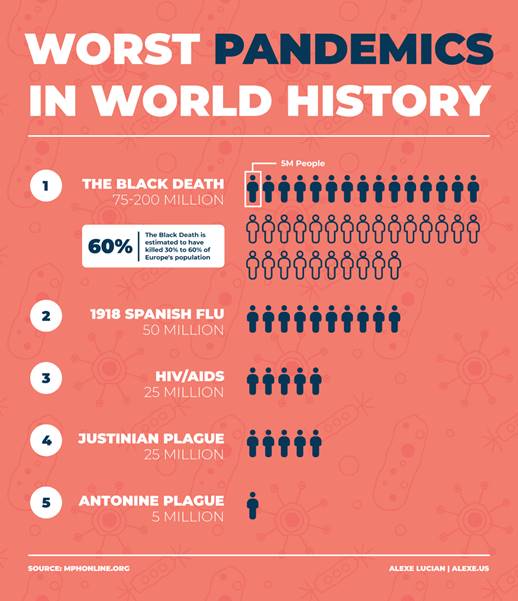
The Black Death may have reduced the world’s population from an estimated 475 million to 350–375 million in the 14th century.
Viruses aren’t sporting. They will not refrain from kicking you just because another virus has already knocked you to the floor. And pandemics are capricious. Despite a lot of research, “we haven’t found a way to predict when a new one will arrive,” says Nídia Trovão, a virologist at the National Institutes of Health. As new diseases emerge at a quickening pace, the only certainty is that pandemics are inevitable. So it is only a matter of time before two emerge at once.
Chinese scientists said the virus will likely return in waves due in part to the prevalence of asymptomatic carriers. In past outbreaks, those who get sick are easily identified and quarantined, but that is not the case with SARS-CoV-2. So at the very least and even with good vaccines we can expect some impact from COVID in future years.
Life Quality and Actual Costs of COVID Infections Pegged at $5.5 Trillion per Year
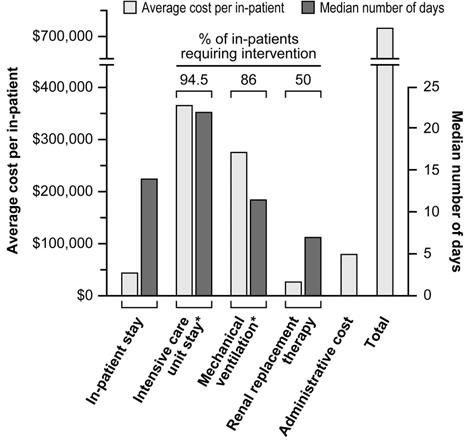
Hospital costs alone for a COVID patient can run over $700,000.
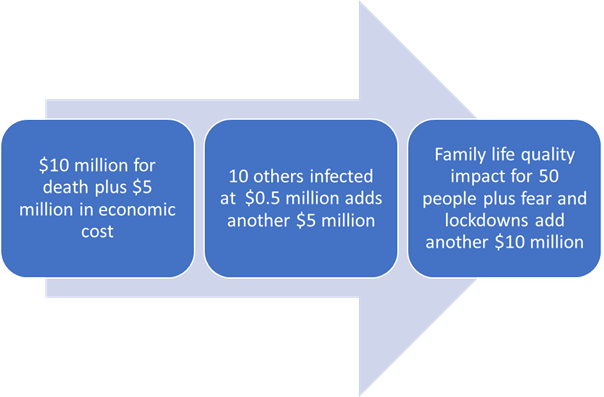
Total healthcare costs will add substantially. When the costs associated with the illness of an additional ten others for every death and the impacts on the families, businesses and community of the total cost per death is calculated at $25 million.
There have now been 23 million COVID cases and 800,000 deaths worldwide. New cases are running 250,000 per day and deaths are 6,000. If this pace continues there will be 2.2 million deaths in the next 12 months and 91 million cases. The cost is estimated at $5.5 trillion combining both actual cost and quality of life reduced by loss of loved ones and restrictions on activities.
Efficient masks and filters could cut the death rate in half and justify an annual expenditure of $2.25 trillion.