CONTENTS OVERVIEW
The new on line Water & Wastewater Treatment Chemicals report provides many advantages not available in the previous printed report. There are many more specific forecasts. The query system is extremely user friendly and allows the viewer to obtain the specific totals he needs without having to aggregate individual numbers. The forecasts are backed by extensive documentation and determination of the basic factors behind the numbers. The fact that the forecasts change continually means that you always have the latest insights.
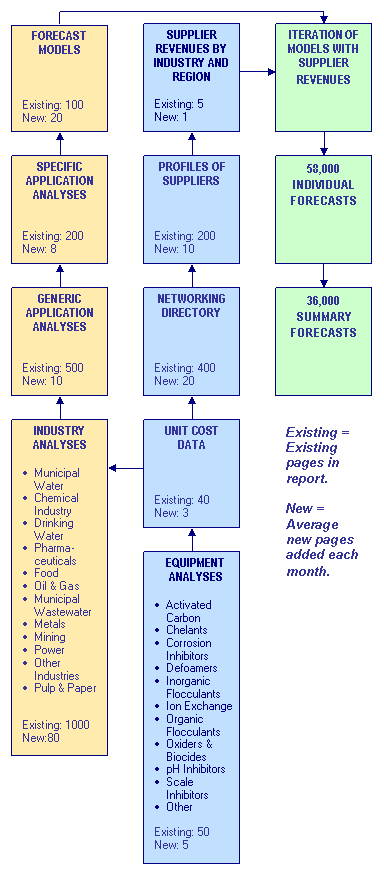
The power of the system is displayed in the accompanying chart. The analysis sequence consists of two paths.. One path results in forecasts of chemical revenues based on industry models. The other path results in aggregation of the revenues of the suppliers. For the present year the aggregation of the supplier revenues has to equal the forecast model. If it doesn’t then the model has to be changed. The corrected model is then used to forecast future years.
One example of the use of the models is in municipal water treatment. How many treatment plants (measured in mgd) will be built in China each year over the forecast period? This a number which we are spending lots of hours to determine. The next question is whether the relative use of organic and inorganic flocculents will be the same in $/mgd as in the basic model. These questions are addressed in the “specific application analyses”. They are preceded by the generic analyses.
As you can see from the above charts there is a category entitled generic application analyses. In this segment for each industry we attempt to determine the liquid flow requirements for the processes. For example in the power industry there will be big expenditures for boiler feedwater treatment. What are the process requirements? What quantities are involved? These are the questions answered in the “generic application” section This contrasts to a specific application analysis in Power which focuses on specific chemical selection such as the relative use of scale inhibitors.
Based on the generic and specific application analyses and the industry production rates contained in the “industry analyses” sections models are determined which provide present and future revenues for each of the equipment types in each industry in each country. However these models need validation. This is where the second analysis path comes into play. A networking directory identifies the universe of suppliers of each equipment type in each region of the world. Profiles of the larger companies become the basis of individual company revenue determinations. The aggregate of these individual revenues for the past year is compared to the models in the upper path. An iteration of these two approaches results in a validated model.
WATER & WASTEWATER TREATMENT CHEMICALS CONTENTS OVERVIEW CHART