SEDIMENTATION AND CENTRIFUGATION CONTENTS OVERVIEW
Since 1980 McIlvaine has been analyzing separation markets and technology. The “Liquid Filtration Knowledge Network” and the “Sedimentation and Centrifugation Knowledge Network” have been building and building. The September 2002 Sedimentation/Centrifugation Newsletter was #273. Over 10,000 journal and conference articles on the two subjects have been abstracted, key worded and stored for instant delivery to clients.
By the early 1980s suppliers were hiring McIlvaine for market research. This resulted in a multi- client market report “Sedimentation and Centrifugation: World Markets” which has been published every three to four years since the 1980s. Now McIlvaine is taking a giant step (at least a giant step for a little company) by converting this report from periodic, with hundreds of forecasts, to continuous with 40,000 forecasts. This seems like an impossible task. However, we find that our clients provide valuable input and help ensure the needed accuracy.
You may ask why suppliers are volunteering information which may help their competitors. The answer is that most people realize that a rising tide floats all ships. A more accurate forecasting tool is going to minimize the building of over-capacity. More importantly, by providing forecasts for every niche in every country we are unleashing the power and knowledge of the local salesman. We are already getting great feedback in our cartridge forecasts from people like a local salesman in Germany supplying cartridges to the food industry. He questioned the revenue forecast for 2002 for non woven cartridges in food applications in Germany and in particular argued that the number in comparison to the French number was not logical. This input caused us to review this forecast.
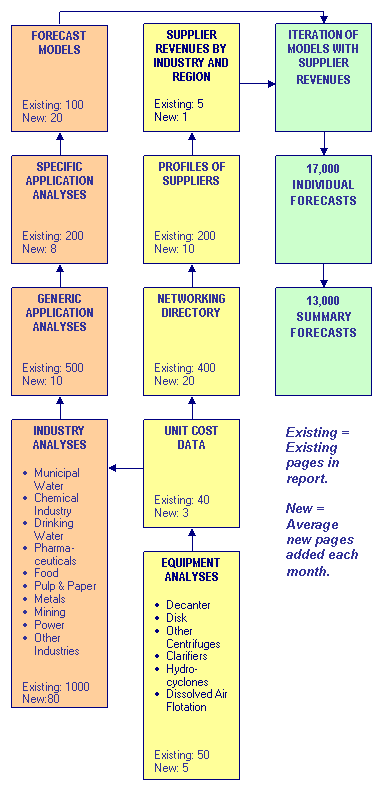
The power of the system is displayed in the accompanying chart. The analysis sequence consists of two paths. The first path results in forecasts of sedimentation and centrifugation revenues based on industry models and the second path results in aggregation of the revenues of the suppliers. For the present year the aggregation of the supplier revenues has to equal the forecast model. If it doesn’t then the model has to be changed. The corrected model is then used to forecast future years. Whereas suppliers are very knowledgeable about their own sales in the present and in the past and have decent knowledge about competitor present and historic sales, they do not have this knowledge about the future.
Suppliers, of course, have invaluable insights about the future. But without the comprehensive models relative to each industry the forecasts of future sales are not going to be overly reliable. How many secondary treatment plants (measured in mgd) will be built in China each year over the forecast period? This is a number that we are spending lots of hours to determine. The next question is whether these treatment plants will use centrifuges, belt presses, or drying beds for dewatering.
Another question is whether the Chinese will purchase the more expensive foreign centrifuges or opt for those made within the country. The answers to these questions are needed in order to determine the model of dollars/mgd of new secondary treatment capacity. We would classify this question under the heading of “specific application analysis.”
As you can see from the chart, there is also a category entitled “Generic Application Analyses.” In this segment for each industry we attempt to determine the separation requirements for the processes. For example, in the power industry there will be big expenditures for flue gas desulfurization. Hydrocyclones, clarifiers, decanters, and basket centrifuges are all used. What are the process requirements? What quantities are involved? These are the questions answered in the “Generic Application” section. This contrasts to a specific application analysis in “Power” which focuses on specific equipment selection such as the relative use of basket centrifuges versus belt filters for gypsum dewatering.
Based on the “Generic Application Analyses”, the “Specific Application Analyses” and the industry production rates contained in the “Industry Analyses” sections, models are determined which provide present and future revenues for each of the equipment types in each industry in each country. However, these models need validation. This is where the analyses path comes into play. A networking directory identifies the universe of suppliers of each equipment type in each region of the world. Profiles of the larger companies become the basis of individual company revenue determinations. The aggregate of these individual revenues for the past year is compared to the models in the upper path. An iteration of these two approaches results in a validated model.
This validated model is then used to project future revenues. The result is 26,000 specific revenue forecasts (9 industries x 6 equipment types x 80 countries x 6 years). These forecasts are aggregated by country and region and equipment type resulting in another 14,000 forecasts. However, the forecasts are displayed as a result of queries. There are nine different query options. Therefore, the 40,000 forecasts can be displayed 9 different ways resulting in more than 100,000 different page displays of forecasts.
The system is built on the industry analyses. Forecasts for the power industry, for example, are changing continually. We estimate that there will be at least 100 page changes a month in the industry analyses. By contrast the comparisons and analyses of the basic equipment will only change occasionally (3 pages/month average); other sections will change at varying rates.
This brings us to the issue of printed versus online access to the data. The advantages of the printed copy are numerous. The limitations are equally numerous. Our solution is to provide one-time printed copies where desired but to make the online reports easy to print. We are using techniques such as “book marking.” This allows you to click on a specific section but to print out a whole chapter. We will continue to react to clients’ wishes and make the system as “user friendly” as possible.
SEDIMENTATION AND CENTRIFUGATION CONTENTS OVERVIEW CHART

