FGD
and DeNOx
NEWSLETTER
January 2010
No. 381
EPA Proposes New SO2 NAAQS
On November 16, 2009, EPA proposed to strengthen the National Ambient Air Quality Standard (NAAQS) for sulfur dioxide (SO2). EPA is proposing to revise the primary SO2 standard, designed to protect public health, to a level of between 50 and 100 parts per billion (ppb) measured over 1-hour. The existing primary standards are 140 ppb measured over 24-hours and 30 ppb measured over an entire year. The Agency also is taking comment on alternative levels for the 1-hour standard up to 150 ppb and proposing to revoke both the current primary SO2 standards.
Evaluation of scientific information and the risks posed by breathing SO2 indicate that a 1-hour standard would better protect public health by reducing people’s exposure to high short-term (five minutes to 24 hours) concentrations of SO2.
EPA is also proposing changes to the ambient air monitoring and reporting requirements for SO2. These proposed requirements are expected to result in a minimum of 348 SO2 monitoring sites. At the end of 2008, there were 488 SO2 monitors in the network. EPA estimates that at least one-third of the SO2 monitors in this existing network may meet the proposed siting requirements. States may, with EPA approval, relocate the existing monitors to meet the new siting requirements. EPA is proposing to require that all new SO2 monitors be operational by January 1, 2013.
EPA will accept comments for 60 days after the proposed rule is published in the Federal Register. The Agency will hold a public hearing on the proposed rule January 5, 2010 in Atlanta. EPA will issue a final rule by June 2, 2010.
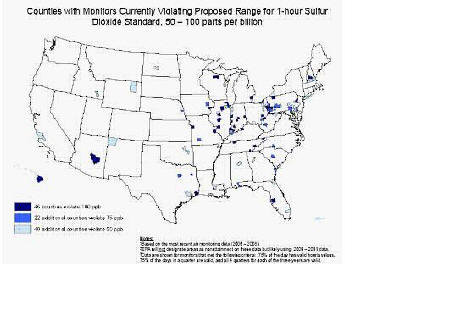
If EPA promulgates a new standard for SO2, the Agency expects to identify or “designate” areas as meeting or not meeting the standard (or as unclassifiable) in 2012, within two years of the effective date of the standard. The map in Figure 1 shows counties with monitors currently recording 1-hr SO2 levels above 100 ppb, 75 ppb and 50 ppb.
Figure 1.
For the new 1-hour SO2 standard, EPA is proposing that the form be a 3-year average of the 4th highest daily maximum 1-hour average concentration in a year or its equivalent (a 3-year average of the 99th percentile of the annual distribution of daily maximum 1-hour average concentrations).
Generally, EPA expects that the nation will be able to make significant progress towards attainment of a tighter SO2 NAAQS without the addition of new controls beyond those already being planned for the attainment of existing PM2.5 standards by the year 2020. As States develop their plans for attaining these existing standards, they are likely to consider adding controls to reduce sulfur dioxide, as SO2 is a precursor to PM2.5. These controls will also directly help areas meet a tighter SO2 standard. In the analysis EPA did, controls were applied to uncontrolled coal‐fired units (EGUs) of 100 MW and larger within the 50 km radius of violating monitors. Each unit has the option of retrofitting with a wet FGD with 95 percent efficiency or retiring. To reduce non-EGU point SO2 emissions, least cost control measures were identified for emission sources within 50 km of the violating monitor. Figure 2 gives examples of control measures applicable to non-EGUs.
Figure 2. Example SO2 Control Measures for Non-EGU Point Sources
|
Control Measure |
Sectors to which these Control Measures can be Applied |
Control Efficiency (percent) |
Average Annualized Cost/ton (2006$) |
|
Wet and Dry FGD and SDA |
ICI boilers – all fuel types, kraft pulp mills, Mineral Products (e.g., Portland cement plants all fuel types), petroleum refineries |
90—FGD or SDA |
$800-8,000—FGD $900-7,000—SDA |
|
Increase percentage sulfur conversion to meet sulfuric acid NSPS (99.7% reduction) |
Sulfur recovery plants |
75 to 95 |
$4,000 |
|
Sulfur recovery and/or tail gas treatment |
Sulfuric Acid Plants |
95-98 |
$1,000-4,000 |
|
Cesium promoted catalyst |
Sulfuric Acid Plants with Double-Absorption process |
50% |
$1,000 |
Sources: AirControlNET 4.2 control measures documentation report (May 2008), and Comprehensive Industry
Document on Sulphuric Acid Plant, Govt. of India Central Pollution Control Board, May 2007. The estimates
for these control measures reflect applications of control where there is no SO2 control measure currently
operating except for the Cesium promoted catalyst.
In applying these SO2 controls, EPA employed a decision rule in which EPA did not apply controls to any non-EGU source with 50 tons/year of emissions or less. It should be noted that no SO2 controls are applied to on-road and non-road mobile sources because measures to reduce the sulfur content from diesel engines will be well‐applied in on-road and non-road mobile source fleets by 2020, and thus there is little capability to achieve further reductions for this analysis.
Figure 3 presents the emission reductions achieved through applying control measures, both by sector and in total. As this table reveals, a majority of the emission reductions were achieved through EGU emission controls.
Figure 3. Emission Reductions from Identified Controls in 2020 in Total
and by Sector (Tons)a for Each Alternative Standard
|
|
50 ppb |
75 ppb |
100 ppb |
150 ppb |
|
Total Emission Reductions from Identified Controls: |
760,000 |
439,000 |
343,000 |
162,000 |
|
EGUs |
550,000 |
317,000 |
256,000 |
119,000 |
|
Non-EGUs |
209,000 |
122,000 |
87,000 |
44,000 |
|
Area Sources |
1,000 |
100 |
0 |
0 |
a All estimates rounded to two significant figures. As such, totals may not sum down columns.
Thirty-one of the 57 monitor areas are expected to reach attainment with the alternative standard of 50 ppb following implementation of the identified control strategy. For 26 areas, identified controls are not sufficient to reach attainment with the 50 ppb standard. However, there are twelve areas out of attainment with the 75 ppb alternative standard, eight areas out of attainment with the 100 ppb alternative standard, and only two out of attainment with the 150 ppb alternative standard.
See: http://www.epa.gov/air/sulfurdioxide/actions.html#nov09 for more information.
Back to FGD and DeNOx Newsletter No. 381Table of Contents