FGD WORLD MARKET
UPDATE
January 2010
McIlvaine Company
TABLE OF CONTENTS
New MW Forecasts, Webinars and Other Additions
Minnesota PCA Passes Haze Rules for Northern Parks
Oklahoma Working on Regional Haze Rules
Progress Energy to Retire Four Coal-fired Power Plants by 2017 instead of Adding FGD
SPX to Design and Install Flue Gas Discharge System at Cardinal
EPA will Promulgate Mercury Rules by 2011
Great Conference Slated for Shanghai May 5-7
Chinese FGD Systems are removing 73 Percent of the Mercury
Hitachi has installed SCR Systems in 38 Chinese Power Plants
HKE Completes First Phase of Emission Reduction Program
Delkor has Supplied 50 Belt Filters for China for FGD Gypsum Dewatering
Huaneng Yueyang Phase III will involve ESPs, FGD, DeNOx and CEM
Zhejiang Feida building Lots of High Efficiency ESPs for the Power Industry
China Pledges Greenhouse Gas Reductions
Many projects are detailed in monthly updates under Industry Analysis in this Report’s Chapters. Click on the links below to view information on these projects.
Fossil and Nuclear Power Generation: World Analysis and Forecast
In December the MW forecasts were revised for each country. See “Specific FGD MW Forecast” The new overview reflects the latest totals. Recent webinars include Wet vs Dry FGD. A number of audio interviews were recorded at Power-Gen in Las Vegas.
We have just published forecasts that coal-fired power generation will increase by 800,000 MW between now and 2020. Most of this forecast is based on power plants already planned or under construction in Asia, so you could eliminate all the coal-fired power plants in Western countries and still have a net increase in CO2 from coal-fired power generation. We project a 500,000 MW increase in gas turbine generation. You could eliminate all the gas turbine capacity in western countries and still have a net CO2 increase.
There is an unreality about Copenhagen which is very puzzling. We are conditioned to less than logical assertions by Al Gore and other political figures, but were amazed to hear one from a Nobel Prize-winning economist. He stated that you should not base policy on the average risk, but on the most calamitous prediction. If you follow that logic relative to a nuclear holocaust or a gigantic meteor strike you would have to rank both these perils higher than global warming. Fortunately, the worse the calamity the less likely it is to happen. In our Sustainability Universal Rating System we include “Important Event Odds.” The magnitude of the negative event is multiplied by the odds against it happening. This product is then multiplied by the Quality Enhanced Life Days (QELD) lost. Then any future calamity can be compared to any other. The QELD for alternative uses of the funds can also be compared. The winner should be the lowest cost per QELD.
Who can argue that wind and solar energy are not great alternatives to coal-fired and gas-fired energy? The problem is that for the next several decades, fossil fuels will be the economical choice for most power generations. McIlvaine is introducing a Utility CO2 Mitigations Market report, expanding coverage of gas turbine power plants and components, initiating a database of nuclear power projects with details on products and services for each. McIlvaine already publishes Renewable Energy and Biofuels reports, so balanced coverage of all energy alternatives will be achieved. But for the present do not count out “fossil”.
The Minnesota Pollution Control Agency (PCA) has approved new regulations to curb haze over northern Minnesota despite complaints of federal land managers and environmental groups that the rules don’t go far enough. The agency’s board voted 7-1 for the measures, aimed at combating haze over pristine areas like Voyageurs National Park, Isle Royale National Park and the Boundary Waters Canoe Area Wilderness that are protected under federal Clean Air Act rules. The rules may eventually affect coal-burning power plants and taconite plants in Minnesota, as well as pulp and paper mills and other industries that may be required to install new haze-cutting pollution-control technology. PCA officials say the new rules are the first step toward cleaner skies over northern Minnesota, cutting 30,000 tons of the haze-causing emissions annually. The rules must be approved by the federal Environmental Protection Agency, which has ordered that air over national parks and wild lands should be haze-free by 2064.
The Oklahoma Department of Environmental Quality (DEQ) is on the clock to come up with a proposal to reduce regional haze in federal wildlife areas. DEQ hosted a public hearing Wednesday to allow comments on the plan, which two of the state’s largest utility companies insist could cost them a lot of money. Oklahoma Gas and Electric Co. (OG&E) was the most vocal critic of the plan which officials said could force the utility company to spend more than $1 billion to install scrubbers to clean emissions at its coal-fired power plants. Instead OG&E wants DEQ to amend the plan so the company can reduce emissions by switching from coal to natural gas to fuel the majority of its power plants.
Progress Energy Carolinas said that all of its remaining coal-fired power plants in North Carolina without FGD will be retired by 2017. The plan includes 11 coal-fired units totaling 1,485 MW. The plants scheduled for retirement are:
The company’s 174 MW Robinson Plant in South Carolina is not affected by the announcement.
SPX Corporation’s Thermal Equipment and Services segment was awarded a contract in September of approximately $47 million to install a state-of-the-art flue gas discharge system and other upgrades to enhance the existing natural draft cooling tower at 1830 MW coal-fired Cardinal Station. Treated flue gases will be conveyed from the FGD system into the cooling tower through one or two glass-fiber reinforced plastic ducts and discharged into the atmosphere together with the cooling tower plume. This combination of flow allows for improved mixing and updraft into the atmosphere. "Our flue gas discharge technology can help some new and existing coal-fired plants using natural draft cooling towers achieve enhanced cooling efficiencies," said Drew Ladau, SPX segment president. "And in some cases it may even potentially reduce costs," he added. Preliminary on-site work on the cooling system retrofit will begin as early as this year. The final flue gas discharge system installation expected to be completed in 2012 during the commissioning of a new FGD system that Cardinal Station expects will reduce SO2 emissions by more than 98 percent.
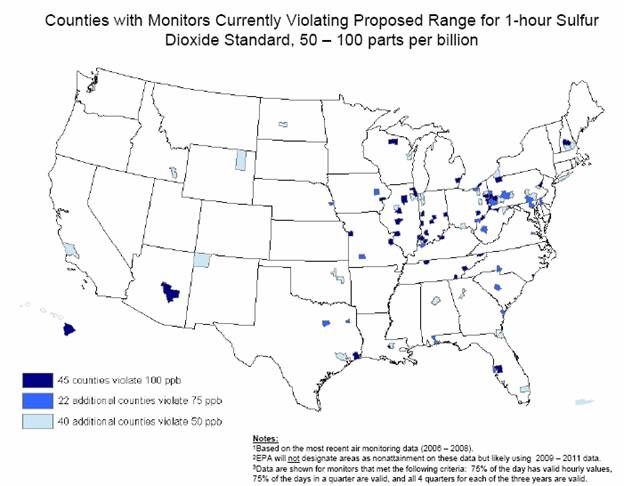
On November 16, 2009, EPA proposed to strengthen the National Ambient Air Quality Standard (NAAQS) for sulfur dioxide (SO2). EPA is proposing to revise the primary SO2 standard, designed to protect public health, to a level of between 50 and 100 parts per billion (ppb) measured over one-hour. The existing primary standards were 140 ppb measured over 24-hours, and 30 ppb measured over an entire year. The Agency also is taking comment on alternative levels for the one-hour standard up to 150 ppb and proposing to revoke both the current primary SO2 standards.
Evaluation of the scientific information and the risks posed by breathing SO2 indicate that a one-hour standard would better protect public health by reducing people’s exposure to high short-term (five minutes to 24 hours) concentrations of SO2.
EPA is also proposing changes to the ambient air monitoring and reporting requirements for SO2. These proposed requirements are expected to result in a minimum of 348 SO2 monitoring sites. At the end of 2008, there were 488 SO2 monitors in the network. EPA estimates that at least one-third of the SO2 monitors in this existing network may meet the proposed siting requirements. States may, with EPA approval, relocate the existing monitors to meet the new siting requirements. EPA is proposing to require that all new SO2 monitors be operational by January 1, 2013.
EPA will accept comments for 60 days after the proposed rule is published in the Federal Register. The Agency will hold a public hearing on the proposed rule January 5, 2010 in Atlanta. EPA will issue a final rule by June 2, 2010.
If EPA promulgates a new standard for SO2, the Agency expects to identify or “designate” areas as meeting or not meeting the standard (or as unclassifiable) in 2012, within two years of the effective date of the standard. The map below shows counties with monitors currently recording one-hr SO2 levels above 100 ppb, 75 ppb and 50 ppb.
Bringing to an end a much-prolonged lawsuit filed by environmentalists, the Environmental Protection Agency (EPA) last Friday agreed to promulgate the standards to restrict mercury emissions from oil- and coal-fired power plants by late 2011. The new agreement between EPA and environmental and public health groups has fixed the deadline for the EPA to set pollution standards by November 16, 2011. The time limit was finalized in a consent decree issued by the Federal District Court in Washington.
For the new one-hour SO2 standard, EPA is proposing that the form be a three-year average of the fourth highest daily maximum one-hour average concentration in a year or its equivalent (a three-year average of the 99th percentile of the annual distribution of daily maximum one-hour average concentrations).
Generally, EPA expects that the nation will be able to make significant progress towards attainment of a tighter SO2 NAAQS without the addition of new controls beyond those already being planned for the attainment of existing PM2.5 standards by the year 2020. As States develop their plans for attaining these existing standards, they are likely to consider adding controls to reduce sulfur dioxide, as SO2 is a precursor to PM2.5. These controls will also directly help areas meet a tighter SO2 standard.
In the analysis EPA did, controls applied to uncontrolled coal‐fired units (EGUs) of 100 MW and larger within the 50 km radius of violating monitors. Each unit has the option of retrofitting with a wet FGD with 95 percent SO2 reduction efficiency or retiring. To reduce non EGU point SO2 emissions, least cost control measures were identified for emission sources within 50 km of the violating monitor. The figure below gives examples of control measures applicable to non EGUs.
Table 4-1:
Example SO2 Control Measures for Non-EGU Point Sources Applied in
Identified
Control Measures Control Strategy Analyses a
|
Control Measure |
Sectors to which these Control Measures can be Applied |
Control Efficiency (percent) |
Average Annualized Cost/ton (2006$) |
|
Wet and Dry FGD scrubbers and SDA |
ICI boilers – all fuel types, kraft pulp mills, Mineral Products (e.g., Portland cement plants (all fuel types), petroleum refineries |
90—FGD scrubbers or SDA |
$800-$8,000—FGD $900-7,000—SDA |
|
Increase percentage sulfur conversion to meet sulfuric acid NSPS (99.7% reduction) |
Sulfur recovery plants |
75 to 95 |
$4,000 |
|
Sulfur recovery and/or tail gas treatment |
Sulfuric Acid Plants |
95-98 |
$1,000-4,000 |
|
Cesium promoted catalyst |
Sulfuric Acid Plants with Double-Absorption process |
50% |
$1,000 |
Sources: AirControlNET 4.2 control measures documentation report (May 2008), and Comprehensive Industry
Document on Sulphuric Acid Plant, Govt. of India Central Pollution Control Board, May 2007.
The estimates for these control measures reflect applications of control where there is no SO2 control measure currently operating except for the Cesium promoted catalyst.
In applying these SO2 controls, EPA employed a decision rule in which EPA did not apply controls to any non-EGU source with 50 tons/year of emissions or less. It should be noted that no SO2 controls are applied to onroad and nonroad mobile sources because mobile source measures to reduce sulfur content from diesel engines will be well applied in onroad and nonroad mobile source fleets by 2020, and thus there is little capability to achieve further reductions for this analysis.
The table below presents the emission reductions achieved through applying control measures, both by sector and in total. As this table reveals, a majority of the emission reductions were achieved through EGU emission controls.
Table 4.2: Emission Reductions from Identified Controls in 2020 in Total and by Sector (Tons) a, b for Each Alternative Standard
|
|
50 ppb |
75 ppb |
100 ppb |
150 ppb |
|
Total Emission Reductions from Identified Controls: c |
760,000 |
439,000 |
343,000 |
162,000 |
|
EGUs |
550,000 |
317,000 |
256,000 |
119,000 |
|
Non-EGUs |
209,000 |
122,000 |
87,000 |
44,000 |
|
Area Sources |
1,000 |
100 |
0 |
0 |
a. All estimates rounded to two significant figures. As such, totals may not sum down columns.
b. All estimates provided reflect the application of the identified control strategy analysis, incremental to a 2020 baseline of compliance with the current PM2.5 standards, and the necessary emission reductions estimated for attainment as shown in Chapter 2 for the areas covered by this analysis.
c. These values represent emission reductions for the identified control strategy analysis. There were locations not able to attain the alternative standard being analyzed with identified controls only.
Thirty-one of the 57 monitor areas are expected to reach attainment with the alternative standard of 50 ppb following implementation of the identified control strategy. For 26 areas, identified controls are not sufficient to reach attainment with the 50 ppb standard. However, there are twelve areas out of attainment with the 75 ppb alternative standard, eight areas out of attainment with the 100 ppb alternative standard, and only two out of attainment with the 150 ppb alternative standard. See Regulatory Actions | Sulfur Dioxide | US EPA for more information.
How can you select a conference title more appropriate to what we do? It is titled “The 14th Sulfur Dioxide, Nitrogen Oxide, Mercury and Fine Particle Pollution Control Technology & Management International Exchange Conference.” McIlvaine is working with the various Chinese sponsors to make sure that this conference maximizes its title claim. There is no exhibition but for a nominal price there is the opportunity to provide a presentation, so it is a much more cost effective way to make the needed contacts.
McIlvaine will be working to help promote the conference with China, as well as working to assure that high quality relevant papers are provided by international experts. McIlvaine will also attempt to maximize networking at the conference. McIlvaine has an office in Shanghai and already publishes Chinese Utility Plans in English and Chinese. If you would like more information on the conference, contact Bob McIlvaine at 847-784-0012 ext. 112 or by email at rmcilvaine@mcilvainecompany.com
Chinese FGD
Systems are removing 73 Percent of the Mercury
Comprehensive field measurements were made by Tsinghua
University, Beijing researchers to understand mercury emissions and a report
was prepared in November 2009. Characterization and behavior of mercury
emissions were measured in six typical coal-fired power plants in China. During
the tests, the flue gas was sampled simultaneously at inlet and outlet of the
SCR, ESP, and FGD using the Ontario Hydro Method (OHM). The pulverized coal,
bottom ash, fly ash and gypsum were also sampled in the field. Mercury
concentrations in the coal burned ranged from 17 to 385 μg/kg. The mercury mass
balances for the six power plants varied from 87 to 116 percent of the coal’s
mercury level. The total mercury concentrations in the flue gas for the whole
system were in the range of 1.92–27.15 μg/m3, which were
significantly related to the mercury content of the coal-fired.
The mercury speciation in the flue gas right after the boiler is influenced by the halogen, mercury, and ash in the coal fired. The average mercury removal efficiencies of the ESP, ESP plus wet FGD, and ESP plus dry FGD-FF systems were 24 percent, 73 percent and 66 percent, respectively, which were similar to the average removal efficiencies of these systems in other countries such as the US, Japan and South Korea. The SCR system oxidized 16 percent of the elemental mercury and reduced about 32 percent of the total mercury. Elemental mercury, accounting for 66–94 percent of the total mercury, was the dominant species emitted to the atmosphere. The mercury emission factor was also calculated for each power plant. Details are found at
The SCR system installed on Beijing Guohua Electric Power Corporation’s Ninghai Unit 4 was the first SCR system implemented on the Chinese mainland through Chinese capital investment. This SCR system was implemented as a project set up between Babcock-Hitachi K.K., with Hitachi, Ltd. as the main contractor, and Zhejiang University Energy Technology Co., Ltd. as a local partner. Trial operation was completed in November 2006. In response to the growth in the Chinese SCR business, Babcock-Hitachi has transferred SCR technology to three Chinese manufacturers. At the end of September 2008, the Hitachi Group took the lead in the Chinese SCR market with orders received for SCR systems and catalyst for 38 power plants (with a total capacity of about 23,000 MW). See
http://www.mcilvainecompany.com/FGD_Markets/subscriber/updates/2010 updates/hitachi forjan10fgd.pdf
HKE Completes First Phase of Emission Reduction Program
HK Electric has completed the first of a two-phase emission reduction program at the Lamma power station with the commissioning of a limestone-gypsum FGD plant and a low-NOx burner system for coal-fired Unit 5. The FGD on Unit 5 will cut more than 90 percent of SO2 emissions while the low-NOx burner will reduce the formation of NOx by over 60 percent. According to HK Electric's general manager (projects), Dr C W Tso, the completion of the entire program in April 2010 will reduce the emissions of SO2, NOx and suspended particulates by 11,800 tonnes, 3,300 t and 114 t respectively. Gypsum produced in the FGD process will be sold, and last year 77,000 tonnes of gypsum from three HK Electric FGD plants were sold for industrial use.
Delkor has Supplied 50 Belt Filters in China for FGD Gypsum Dewatering
Delkor has successfully completed projects throughout China, including the installation of the first horizontal belt filters on the FGD process.
Delkor Group FGD Reference List – CHINA
|
CLIENT |
NUMBER OF UNITS |
APPLICATION |
|
Huaneng Power Corp |
1 |
40m2 Calcium Sulfate Washing |
|
Lin Kou Power Station |
3 |
12 m2 Calcium Sulfate Washing |
|
BHKK, Taiyuan No. 1 |
1 |
7 m2 Calcium Sulfate Dewatering |
|
MHI, Louhang I |
1 |
40 m2 Calcium Sulfate Dewatering |
|
MHI, Louhang II |
1 |
34 m2 Calcium Sulfate Washing |
|
Steinmueller, Banshan |
2 |
9 m2 Calcium Sulfate Washing |
|
Steinmueller, Beijing |
2 |
6 m2 Calcium Sulfate Washing |
|
Steinmueller, Chongqing Phase1 |
1 |
39 m2 Calcium Sulfate Washing |
|
IHI, Hsinta, Taiwan |
3 |
22 m2 Calcium Sulfate Washing |
|
Cetic / Longyuan, Jingneng |
1 |
20 m2 Calcium Sulfate Washing |
|
IHI, Taichung |
3 |
22 m2 Calcium Sulfate Washing |
|
KHI, Anshun |
2 |
29 m2 Calcium Sulfate Washing |
|
Marsulex, Shajiao |
2 |
7 m2 Calcium Sulfate Washing |
|
MHI, Tianjin Dagang |
2 |
10 m2 Calcium Sulfate Washing |
|
SSEP, Yaxi |
2 |
55 m2 Calcium Sulfate Washing |
|
ZTEPEC Changxing |
2 |
22 m2 Calcium Sulfate Washing |
|
SECIHI Baosteel |
2 |
10 m2 Calcium Sulfate Washing |
|
Shanghai Longking, Huangpu |
2 |
12 m2Calcium Sulfate Washing |
|
ZTEPE Lanxi Power |
2 |
35 m2 Calcium Sulfate Washing |
|
ZTEPE Beilun Power |
2 |
42 m2 Calcium Sulfate Washing |
|
CPI Yuanda, Jin Qiao |
2 |
9 m2 Calcium Sulfate Washing |
|
CPI Yuanda, Beijing |
2 |
9 m2 Calcium Sulfate Washing |
|
CPI Yuanda, Zhuhai |
2 |
12 m2 Calcium Sulfate Washing |
|
Guangdong Electrical Design Institute |
2 |
15 m2 Calcium Sulfate Washing |
|
Zhanjiang Power Plant |
2 |
17 m2 Calcium Sulfate Washing |
The Chinese government approved one 600 MW ultra-supercritical coal-fired generating unit of Huaneng Power International’s Phase III project at the Yueyang Power Plant. The Phase III project at Huaneng Yueyang power plant will install high-performance ESPs, FGD and deNOx, as well as a CEM system. Total investment amount is estimated to be about $370 million, of which 20 percent is equity capital to be funded by the company and Hunan Xiang Tou International Investment Co., based on capital contribution ratios of 55 percent and 45 percent, respectively. The remaining investment will be funded by bank loans.
Huaneng Power International, Inc. wholly-owns 18 operating power plants, has controlling interests in 16 operating power plants, and has minority interests in five operating power companies within China. The power plants are located in 12 provinces and four provincial-level municipalities in China. The company also has a wholly-owned generation company in Singapore. Currently, the company has a controlled generation capacity of 43,782 MW and equity-based generation capacity of 40,975 MW.
Zhejiang Feida building Lots of High Efficiency ESPs for the Power Industry
Zhejiang Feida Environmental Protection Technology Co., Ltd. is a major supplier of ESPs. Here is the status of larger projects underway:
Unit Capacity: 1000MW
|
No. |
User |
Boiler No. |
Unit (MW) / Boiler Capacity (T/H) |
Type |
Efficiency % |
Area |
Status |
|
1 |
Tianjin Beijiang Power Plant Phase I |
1# |
1000/3100 |
2F630-5 |
≥ 99.82 |
Tianjin |
Designing |
|
2 |
Tianjin Beijiang Power Plant Phase I |
2# |
1000/3100 |
2F630-5 |
≥ 99.82 |
Tianjin |
Designing |
|
3 |
Guodian Beilun Phase III Expansion Project |
1# |
1000/2996 |
2F684-5 |
≥ 99.75 |
Zhejiang |
Fixing |
|
4 |
Guodian Beilun Phase III Expansion Project |
2# |
1000/2996 |
2F684-5 |
≥ 99.75 |
Zhejiang |
Fixing |
|
5 |
Zhejiang Guohua Ninghai Power Plant Phase II |
5# |
1000/3091 |
2F684-4 |
≥ 99.4 |
Zhejiang |
Fixing |
|
6 |
Zhejiang Guohua Ninghai Power Plant Phase II |
6# |
1000/3091 |
2F684-4 |
≥ 99.4 |
Zhejiang |
Fixing |
|
7 |
Guodian Taizhou Dynamoelectric Co.,Ltd |
1# |
1000/2953 |
2F648-4 |
≥ 99.7 |
Jiangsu |
2008.02 |
|
8 |
Guodian Taizhou Dynamoelectric Co.,Ltd |
2# |
1000/2953 |
2F648-4 |
≥ 99.7 |
Jiangsu |
2008.03 |
|
9 |
Shanghai Waigaoqiao Power Plant Phase III |
1# |
1000/2950 |
2F648-4 |
≥ 99.8 |
Shanghai |
2008.03 |
|
10 |
Shanghai Waigaoqiao Power Plant Phase III |
2# |
1000/2950 |
2F648-4 |
≥ 99.8 |
Shanghai |
2008.05 |
|
11 |
Huaneng Yuhuan Power Plant |
1# |
1000/2953 |
2F648-4 |
≥ 99.7 |
Zhejiang |
2006.11 |
|
12 |
Huaneng Yuhuan Power Plant |
2# |
1000/2953 |
2F648-4 |
≥ 99.7 |
Zhejiang |
2007.01 |
|
13 |
Huaneng Yuhuan Power Plant |
3# |
1000/2953 |
2F648-4 |
≥ 99.7 |
Zhejiang |
2007.01 |
|
14 |
Huaneng Yuhuan Power Plant |
4# |
1000/2953 |
2F648-4 |
≥ 99.7 |
Zhejiang |
2007.12 |
|
15 |
Guohua Suizhong Power Plant Phase II |
3# |
1000/3033 |
2F698-4 |
≥ 99.4 |
Liaoning |
Designing |
|
16 |
Guohua Suizhong Power Plant Phase II |
4# |
1000/3033 |
2F698-4 |
≥ 99.4 |
Liaoning |
Designing |
|
17 |
Zhongdiantou Caojing Power Plant Phase I |
1# |
1000/2955 |
2F684-4 |
≥ 99.8 |
Shanghai |
Fixing |
|
18 |
Zhongdiantou Caojing Power Plant Phase I |
2# |
1000/2955 |
2F684-4 |
≥ 99.8 |
Shanghai |
Fixing |
|
19 |
Huarun Pengcheng Power Plant Phase III |
5# |
1000/3044 |
2F689-4 |
≥ 99.8 |
Jiangsu |
Fixing |
|
20 |
Huarun Pengcheng Power Plant Phase III |
6# |
1000/3044 |
2F689-4 |
≥ 99.8 |
Jiangsu |
Designing |
|
21 |
Huaneng Jinling Power Plant |
1# |
1030/3100 |
2F679-4 |
≥ 99.7 |
Jiangsu |
Designing |
|
22 |
Huaneng Jinling Power Plant |
2# |
1030/3100 |
2F679-4 |
≥ 99.7 |
Jiangsu |
Designing |
|
23 |
Zhongdiantou Pingdingshan Luyang Power Plant Phase I |
1# |
1000/3110 |
2F715-5 |
≥ 99.86 |
Henan |
Designing |
|
24 |
Zhongdiantou Pingdingshan Luyang Power Plant Phase I |
2# |
1000/3110 |
2F715-5 |
≥ 99.86 |
Henan |
Designing |
|
25 |
Guodian Jianbi Power Plant Expansion Project |
13# |
1000/3040 |
2F666-4 |
≥ 99.7 |
Jiangsu |
Signed |
|
26 |
Guodian Jianbi Power Plant Expansion Project |
14# |
1000/3040 |
2F666-4 |
≥ 99.7 |
Jiangsu |
Signed |
|
27 |
Shandong Datang Dongying Power Plant |
1# |
1000/3102 |
2F730-5 |
≥ 99.8 |
Shandong |
Signed |
|
28 |
Shandong Datang Dongying Power Plant |
2# |
1000/3102 |
2F730-5 |
≥ 99.8 |
Shandong |
Signed |
|
29 |
Jiangsu Changshu Power Plant Co., Ltd |
1# |
1000/3098 |
2F698-4 |
≥ 99.8 |
Jiangsu |
Signed |
|
30 |
Jiangsu Changshu Power Plant Co., Ltd |
2# |
1000/3098 |
2F698-4 |
≥ 99.8 |
Jiangsu |
Signed |
China pledged to increase its efforts to limit greenhouse gases, and it said Premier Wen Jiabao would attend the Copenhagen climate summit in December. China's State Council said that by 2020, the country would reduce its carbon dioxide emissions per unit of gross domestic product by 40 to 45 percent compared with levels in 2005. This is "a voluntary action based on our own national conditions" and "is a major contribution to the global effort in tackling climate change," the State Council said. China's State Council said its plan to slow the rate of carbon emissions would come through better research and development, clean coal technology, advanced nuclear energy and better transportation systems.
Qi Jianguo, an economic and environmental policy researcher at the Chinese Academy of Social Sciences, told Xinhua that the targets would put "great pressure" on China's development. "In 2020, the country's GDP will at least double that of now, so will the emissions of greenhouse gases (GHG). But the required reduction of emissions intensity by 40 to 45 percent in 2020 compared with the level of 2005 means the emissions of GHG in 2020 have to be roughly the same as emissions now," he said. In order to achieve the target, more efforts must be made besides strictly abiding by the principle of "energy-saving and emissions reductions," he said. The government will devote major efforts to developing renewable and nuclear energy to ensure the consumption of non-fossil fuel power accounted for 15 percent of the country's total primary energy consumption by 2020, said the State Council.
McIlvaine Company,
Northfield, IL 60093-2743
Tel: 847-784-0012; Fax: 847-784-0061;
E-mail: editor@mcilvainecompany.com;
Web site: www.mcilvainecompany.com