July 19 Webinar Concluded that Coal is still the Major Fuel for Electricity Generation
In the webinar yesterday Bob McIlvaine and Debbie Fox of McIlvaine presented forecasts for the power mix around the world in the coming decade. While the U.S. is preventing construction of new coal-fired power plants the rest of the world thinks differently. Even in Europe there is a likelihood of new coal-fired power plants with low CO2 emissions replacing existing older coal-fired plants. Fossil and nuclear power plants will invest $736 billion on new equipment and repair parts in 2013. Sixty-five percent of the investment will be in coal-fired power plants. This far exceeds the investment in gas turbines.
2013 Fossil-fired and Nuclear Power Generation Market
|
Technology |
Units |
Coal-fired |
Nuclear |
Gas Turbine |
|||
|
|
|
Existing |
New |
Existing |
New |
Existing |
New |
|
Capacity |
GW |
2228 |
128 |
439 |
16 |
1000 |
67 |
|
Total Investment |
$ Billions |
223 |
256 |
88 |
64 |
45 |
60 |
|
Combined New and Existing |
$ Billions |
479 |
152 |
105 |
|||
Despite the virtual moratorium on new coal-fired power plants in the U.S., the rest of the world will spend $256 billion on new coal-fired power plants in 2013. This contrasts with only $60 billion for gas turbine systems. Repair parts and upgrades of existing coal-fired power plants will generate revenues greater than the combined new power plant and repair investments by nuclear and gas turbine combined.
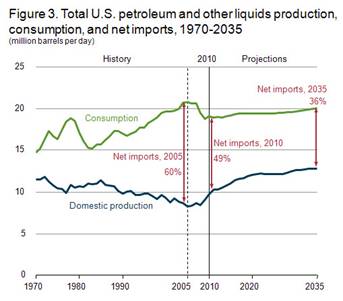
New sources of oil will lessen U.S. oil imports to 36 percent of the total by 2035 according to EIA. But this will not prevent the price of oil from rising to $116/barrel in 2015 and $145/barrel in 2035
Shale gas will replace natural gas and we will be exporting modest amounts by 2035.
The large increase in shale gas production will be offset in part by the rapid production losses in conventional natural gas. The result is that gas prices will increase substantially over the next 20 years.
|
Excerpts from June 2012
EIA Forecast for Fuel Consumption in the U.S. |
||||
|
Fuel type |
2010 |
2015 |
2035 |
|
|
Natural gas |
23 |
25 |
27 |
|
|
Coal |
21 |
18 |
21 |
|
|
Nuclear |
8 |
8 |
9 |
|
|
Fuel Cost ($/MMBtu) |
||||
|
Natural gas |
4 |
4 |
7 |
|
|
Coal |
2 |
2 |
3 |
|
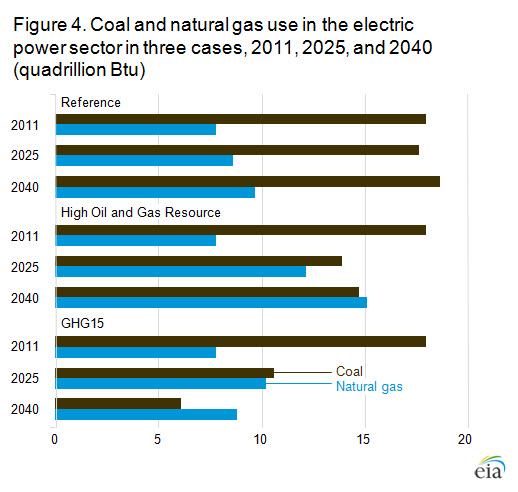
The use of coal will be reduced by some 15 percent in the short term according to the EIA base forecast and then recover to the 2010 levels where it will remain through 2035.
McIlvaine repeated its belief that a meeting of the minds can be achieved between the utilities and the environmentalists. The high short run cost of renewables will insure the continuing use of coal for the next 25 years. The 21 Quads of coal fired presently emit pollutants with the equivalent harm of five billion tons of CO2. (McIlvaine has a common metric to rate the harm for each pollutant).
If the U.S. were to follow the lead of Europe and replace all its old coal-fired power plants with new supercritical plants with the latest emission control equipment the total harm could be reduced by 3.5 billion tons. This is twice all the CO2 emitted by the coal burning plants. In other words the reduction of SO2, NOx, mercury, particulate and CO2 with new power plants will do much more than just adding carbon sequestration to old power plants or a few new power plants. So the agreement should be along the lines of reducing total harm without regard for the mix of pollutants or the age of the power plant.
The U.S. will need to stay competitive with Asia. Let’s compare new coal-fired power plant plans for the regions:
Specific Coal-fired Power MW Forecast
(Megawatts)
|
World Region |
2010 |
2011 |
2012 |
2013 |
2014 |
2015 |
2016 |
2017 |
|
Select All |
89,114.00 |
85,864.00 |
112,884.00 |
125,165.00 |
124,731.00 |
176,800.00 |
144,676.00 |
115,299.00 |
|
Africa |
725.00 |
200.00 |
2,520.00 |
1,300.00 |
4,100.00 |
9,240.00 |
1,350.00 |
5,808.00 |
|
CIS |
330.00 |
330.00 |
0.00 |
450.00 |
760.00 |
600.00 |
620.00 |
500.00 |
|
East Asia |
58,235.00 |
48,129.00 |
47,620.00 |
60,450.00 |
61,074.00 |
69,190.00 |
58,316.00 |
45,290.00 |
|
Eastern Europe |
1,590.00 |
150.00 |
1,000.00 |
1,510.00 |
1,600.00 |
1,600.00 |
4,610.00 |
5,200.00 |
|
Middle East |
120.00 |
1,200.00 |
1,000.00 |
1,200.00 |
500.00 |
0.00 |
4,000.00 |
1,250.00 |
|
NAFTA |
6,805.00 |
2,500.00 |
5,319.00 |
160.00 |
1,232.00 |
2,300.00 |
3,415.00 |
242.00 |
|
South & Central America |
1,620.00 |
1,895.00 |
1,430.00 |
300.00 |
1,580.00 |
0.00 |
2,550.00 |
550.00 |
|
West Asia |
14,330.00 |
29,880.00 |
49,345.00 |
52,210.00 |
51,335.00 |
93,020.00 |
66,255.00 |
55,209.00 |
|
Western Europe |
5,359.00 |
1,580.00 |
4,650.00 |
7,585.00 |
2,550.00 |
850.00 |
3,560.00 |
East Asia will be leading the way with more than 50,000 MW/year of new coal-fired power plants. So every six years they will be building more coal-fired power plants than exist in the U.S. India by 2015 will be the leader in new coal-fired power plant construction. In the 2014-15 period, the world will build more capacity than exists in the U.S.