Evidence Based, Forecast Driven Strategy for
Pump Suppliers
Introduction
The evidence based, forecast driven sales
approach can maximize profits for pump
companies.
There are two variations of the approach based
on whether the pump is in general or high
performance service.
The capital investment and sales decisions are
different for the two performance
classifications. The evidence needed is also
different with one based on logistics and the
other based on product performance. (1)
Pump performance categories are
·
Severe service
·
Critical service
·
Unique service
·
General service
Severe service includes abrasive, corrosive,
high temperature and high pressure applications.
Critical service includes sanitary and
other applications where performance is
important to product quality or safety. Unique
includes special pumps designs for a specific
customer. General includes pumps which are
purchased based more on cost and delivery and
less on performance.
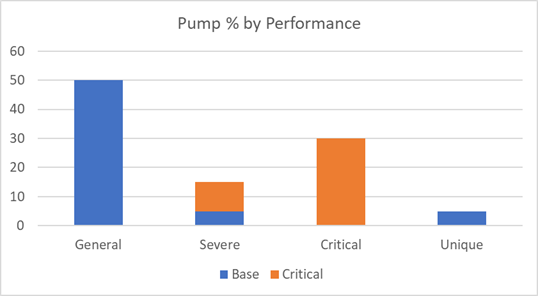
Figure 1 shows the market share percentage for
each type of pump. The critical service category
excludes critical pumps which are also in severe
service.
The severe service, critical and unique, are
high performance service categories. In high
performance service the performance is more
important than price or delivery.
General service includes pumps sold more as a
commodity. So in a food processing plant the
pumps on the municipal water intake pipeline
would be in the general category. The ones
moving food products would be critical. The ones
on the high pressure steam would be severe
service.
From a profitability strategy perspective it is
advantageous to contrast the high performance
and general performance important business
factors. The comparison in Figure 2 shows which
type produces higher results
|
|
High Performance |
General |
|
EBITA % per unit sold |
X |
|
|
EBITA per product total |
|
X |
|
Engineering expense per unit |
X |
|
|
R&D expense per unit |
X |
|
|
Capital Investment |
|
X |
|
Direct Sales |
X |
|
|
Corporate Influence & TCO Analyses |
|
|
|
Sales Volatility |
X |
|
|
Distribution Chain Value |
|
X |
|
Importance of Manufacturing Location |
|
X |
|
Value of Evidence Based Approach |
X |
|
High performance pumps can be sold at higher
prices because of their unique qualities. So
high EBITA can be achieved for a relatively
small number of pumps.
Many general pumps are sold in large
quantities. So EBITA based on total revenue is
higher than for
a small niche market.
EBITA can also be increased with lower
production costs than the competition. This is
more likely with large volume general
performance products.
Engineering and R&D expenses per unit sold are
greater for high performance products to develop
the unique features.
Engineering and R&D for general performance
pumps can be substantial if the focus is
reducing manufacturing costs. But the cost per
unit sold would be low due to the high volume.
Capital investment will typically be higher for
general performance pumps due to the likelihood
that the pumps are produced in a supplier owned
facility. High performance pumps are likely to
include castings and components supplied by
others.
Sales of high performance pumps depend on
conveying knowledge of the superiority. Direct
sales by knowledgeable individuals is important.
General purpose pumps can be purchased with the
simple total cost of ownership analysis based on
price. The purchase of a high performance pump
warrants a total cost of ownership analysis. One
large steel company found that local purchases
tended to be based on price and experience.
This precluded consideration of new and better
pumps.
Corporate staff took over the high performance
pump decision making for all the plants.
The result was a considerable reduction
in total cost of ownership.
A large
chemical company has a corporate staff assigned
to pumps and valves and strives to take
advantage of all the improvements as they occur.
There tends to be volatility in the sales of
high performance pumps. For example the market
for pumps for fracking fluctuates considerably.
The market for pumps used in water intakes in
plants is relatively steady.
The manufacturing location is typically
important for general purpose pumps where
freight costs and delivery time are more
important than for high performance pumps.
Importance of Detailed and Current Forecasts
Very detailed forecasts for general and high
performance pumps are needed. Segmentation of
high performance opportunities by critical,
severe and unique is needed in order to
determine the most profit potential.
In the case of high performance pumps this
forecast will guide R&D and engineering efforts.
In the case of general performance pumps the
forecast will guide manufacturing investment.
Due to the Russian invasion of Ukraine, and the
Chinese lockdown the pump markets are rapidly
changing.
So continuous forecasts are necessary.
The most profitable market can be a large number
of small niches. IDEX is an example of a company
with close to 30% EBITA and fairly large volume.
However the company consists of a number of
independent divisions each pursuing a unique
niche. Identifying these profitable niches
requires much more detailed market analysis than
is typically pursued by pump companies.
|
Niche Forecast Needs |
|||
|
Segment |
TAM |
SOM |
MPM |
|
Countries |
80 |
80 |
180 |
|
Industries |
10 |
15 |
200 |
|
Service |
x |
4 |
4 |
|
Years |
10 |
10 |
10 |
|
Types |
8 |
8 |
40 |
|
Processes |
x |
x |
50 |
|
Total |
64,000 |
384,000 |
28,800,000 |
|
Typical Relevant Niches |
5,000 |
15,000 |
40,000 |
|
Typical Relevant % |
8 |
4 |
1 |
There are various levels of forecasting. The
Total Available Market (TAM) includes all the
opportunities whether or not they can be
serviced and whether or not they are obtainable.
The Serviceable Obtainable Market (SOM) reflects
the market which can be pursued. However much of
this market will not be very profitable. A much
more detailed forecast is needed which analyzes
all the niches and determines where the most
profit can be achieved.
The ability to calculate any of 128 million
niches relies on top down, bottoms up and
horizontal iteration. It would be prohibitively
expensive to conduct for just one category such
as valves. But if the expense is diluted by
including forecasts of equipment using valves
plus complimentary air, water, energy products
the cost for the valve analysis is reduced.
A typical example would be a company of medium
size who would be involved in
5000 niches or 8% of the TAM. With
further segmentation in SOM the number expands
to 15,000. The percentage drops to 4.
The most profitable market may involve 40,000
niches or just 1% of the total. If competitor
market shares and sales quotas for territories
are also included, the number can rise
significantly.
This effort will be relatively expensive but as
part of an evidence based sales program
the benefits far outweigh the costs.
Evidence Based Strategy
The same evidence needed to select the most
profitable market niches is also what is needed
to convince purchasers in those niches that a
pump is superior.
This evidence includes understanding the process
needs in each industry.
Once the most profitable market is determined,
the evidence can be used to validate the lower
total cost of ownership.
This requires analysis of the competitors pumps
and determining the comparative costs.
There is a sequence
to the evidence gathering process
1.
Raw data
2.
Predicate evidence
3.
Disputed evidence
4.
Claims based on the evidence
5.
Rebuttal to counter claims made by competitors
Suppliers have the opportunity to accomplish
steps
2-5 in advertisements, magazine articles,
exhibition activities, white papers and webinars.
It is not enough to prove the lower total cost
of a pump it is necessary to convince the
customers with solid evidence. This is a
challenge but a rewarding one with the potential
to greatly increase revenues and EBITA
(1) Pumps: World Markets published by the
McIlvaine Company