|
WELCOME
Weekly selected highlights in flow
control, treatment and combustion from the many McIlvaine publications.
· Valve Market Share Analysis for 140 Companies
·
Relevant Pump Market Shares
· MBR Market to Exceed $5 billion in 2024
Valve Market
Share Analysis for 140 Companies
The
McIlvaine market share analysis for each valve supplier is valuable for
those companies considering acquisitions, divestiture or seeking to
increase share organically. This continually updated database and
analysis is part of Industrial
Valves: World Markets https://home.mcilvainecompany.com/index.php/markets/water-and-flow/n028-industrial-valves-world-market
There
have been a number of mergers, acquisitions, divestitures, and joint
venture agreements undertaken by valve companies in the last three
years. Emerson has been the most active. The purchase of the valve
operations of Pentair (Tyco) the largest valve producer made Emerson the #
1 producer. In the latest 12 months sales are estimated close to $3.8
billion compared to $1.6 billion for # 2 Cameron Schlumberger. The
largest divestiture was the GE sale of stock in BHGE to the now independent
Baker Hughes with valve sales of $960 million.
Market
shares are being continuously revised to provide worldwide rankings of
valve sales by company and further segmented by corporate location.
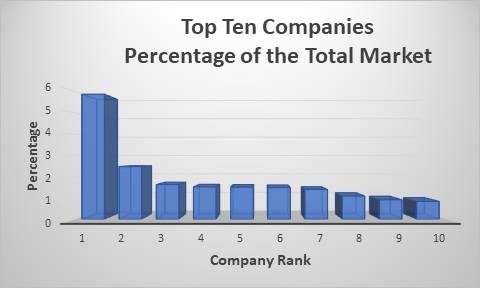
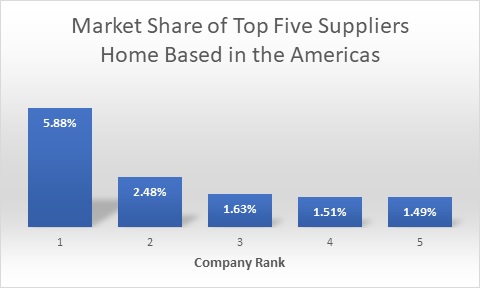
Of
the top six ranked suppliers, five are home based in the U.S. Their
sales are equal to 15 percent of the world market. There sales equal
well over 50 percent of the U.S. market. Their success has come from
penetration of the markets in the other two regions.
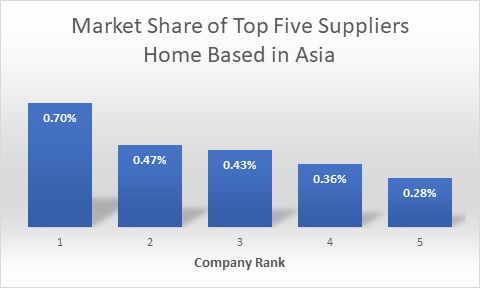
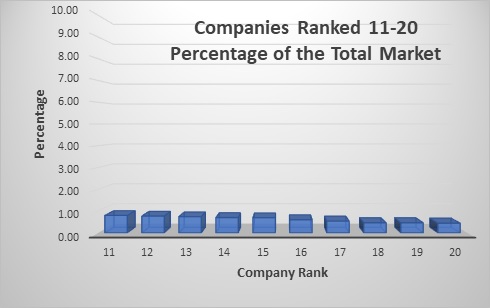
This
low percentage reflects the smaller size of the Asian valve companies.
However, their growth rate is higher and we can expect these percentages to
increase.
Emerson
is home based in the U.S. with 2019 valve sales of $3.79 billion its market
share on a worldwide basis is over 5%. However, this is equal to18% of the
market in the Americas. The fact that Emerson has penetrated the Asian and
EMEA markets has allowed the company to grow even if it would be very
difficult to achieve an 18% share on the continent in which it resides. On
the other hand, Neway has a 0.7% of the total world market. All of its
sales represent only 1.6% of the Asian market. It is growing
internationally. But even if it were not it still las lots of opportunity
in Asia.
Whether
a valve company is selling, buying, or seeking organic growth and higher
profits, the knowledge of valve company market shares is important.
· Selling: In
general, another valve company with synergisms will pay more for a valve
supplier than will a private equity investor. This continuing analysis of
market shares is a good way to select potential acquirers.
· Buying: The
analysis of market shares is very important to valve company acquirers.
This analysis should really be just the starting point. Market shares by
specific product, process, industry, and location are each
significant. While market share for all valves in Asia is part of the
report, it is possible to expand this to market share for turbine bypass
valves for coal fired power plants in India.
· Organic
growth: Sales are not made in a vacuum. Expanding sales means
taking share away from some of the existing suppliers. So, a
market share analysis is the starting point and also a continuing effort.
The competitor share knowledge is important for many throughout the
organization including the local salesperson. As competitors merge
and gain share it is important to track these changes.
· Higher
profits: The # 1 and # 2 suppliers in a given market have the
potential for higher profits due to efficient use of resources. Analyzing
the profitability of competitors provides insights on how to raise profits.
The starting point is market shares.
The
market share analysis reviews recent acquisition attempts as well as hedge
fund led divestiture attempts to compare the goals of those seeking change
to the performance of their targets.
For
more information click on Industrial
Valves: World Markets https://home.mcilvainecompany.com/index.php/markets/water-and-flow/n028-industrial-valves-world-market
Bob
McIlvaine an answer your questions at rmcilvaine@mcilvainecompany.com
847 226 2391
Relevant Pump Market Shares
Management
consultants recommend that companies consider market share as a fundamental
element of business strategy. The
problem is that most market data is unreliable or irrelevant. Knowledge of
industries and processes is necessary in order to determine market size. It
is desirable to determine market share by pump type but also in each
industry and each important market location. Market shares for each major
competitor in each niche also should be determined
Pumps: World
Markets has market
share forecasts for 400 pump companies. It also has purchase forecasts for
the largest 100 pump purchasers and 50,000 forecasts of pump markets by
industry, country and pump type http://home.mcilvainecompany.com/index.php/markets/water-and-flow/n019-pumps-world-market
This
basic report can be expanded to obtain market shares in hundreds of
industry sub segments as shown at
http://home.mcilvainecompany.com/index.php/other-services/free-news/news-releases/47-news/1536-nr2542
A
much more reliable determination of the market is possible with a market
share hierarchy analysis. FGD pumps
is an example. Increased GDP is providing the funds to build coal fired
power plants in Asia. Many countries
in this region are selecting coal as opposed to gas or renewables because
of cost and timing.
|
FGD
Pump Market Share Hierarchy
|
|
Sequence
|
Choice
|
Alternative
|
|
GDP
|
Power
|
Other
|
|
Power
|
Fossil fuels and waste
|
Hydro, wind, solar
|
|
Fossil fuel
|
Coal and waste
|
Gas turbine
|
|
SO2 removal
|
Incorporated
|
Not utilized
|
|
Absorption
|
Wet
|
Dry
|
|
Wet
|
Limestone
|
Lime, ammonia, MgO
|
|
Design
|
Spray tower
|
Tray tower
|
All
these countries are installing flue gas desulfurization systems. Dry systems require only a small
investment in pumps. Wet systems require a big investment. Other process
decisions also impact the market. It is necessary to understand the
processes and predict which will be used. The market for FGD pumps was
determined by this method.
|
FGD
Pump Market 2021 $ millions
|
|
Total Pump
|
60,000
|
|
Power
|
4,000
|
|
Fossil
|
3200
|
|
Coal
|
3,000
|
|
SO2
|
350
|
|
Wet
|
320
|
|
Wet limestone
|
300
|
|
· New
|
130
|
|
o
spray tower
|
110
|
|
o
tray tower
|
20
|
|
· Replace,
repair
|
170
|
|
o
spray tower
|
155
|
|
o
tray tower
|
15
|
There
are differences in the pump requirement depending on the reagent and the
design of the absorber. A tray tower relies on fan energy for mass
transfer. A spray tower relies on twice as much slurry for the same result
but with lower fan energy. The preference is for spray towers. However,
McIlvaine predicts that tray towers will gain market share over the next
five years.
Both
types require the same amount of limestone slurry feed. However, Chinese
plants opt for regional dry grinding rather than purchase of ball mills for
wet grinding at the plant.
Most
plants use forced oxidation and make wall board quality gypsum. Natural oxidation results in a very
difficult sludge which may require reciprocating pumps as the slurry is
mixed with lime to make a landfill product.
Market
Shares of pump companies for this application are impacted by the choice of
absorber, method of grinding, and other process choices.
|
FGD
Pump Market Shares
|
|
Type
of Process
|
Process
option A
|
Process
option B
|
|
Absorber
|
Spray
Tower
|
Tray
Tower
|
|
Absorber recycle pump with up to
500,000 gpm for set of pumps for 1000 MW plant and 98% efficiency. Tray
towers require only 50% of the slurry recycle
|
Trillium, KSB, Duechting, and 3
Chinese companies who can supply pumps to handle 50,000 gpm with largest
now 80,000 gpm
|
The companies with 50,000 gpm
pumps plus the those with flows up to 25,000 gpm such as ITT and many
others who also supply dredging and mining pumps
|
|
Grinding
|
Regional
Dry Grinding
|
Ball
Mill
|
|
Limestone slurry
|
No transport pumps
|
Pumps to transport slurry from the
ball mill to the absorber
|
|
Oxidation
|
Forced
|
Natural
|
|
Transport pumps for slurry
|
Centrifugal at modest cost
|
Reciprocating and higher cost
|
The
market shares of the pump companies provided in Pumps: World Markets can be expanded to include each relevant
niche and to include hundreds of additional competitors beyond the 400
listed.
It
is important to determine market shares in niches such as plastic lined
pumps for chemical and fertilizer applications, pumps for fruit juices,
biopharmaceuticals, lithium mining, and sewage sludge transfer in municipal
wastewater plants.
It
is also desirable to analyze market share from the process perspective. Some
pump companies are involved in the steam cycle with boiler feed water and
condensate pumps. Others are involved just with the water intakes and
wastewater for those plants. Others are involved in processes involving
fluids and slurry e.g. fracking, crude oil.
|
Industry
|
Process
|
Supplier
|
|
F
|
S
|
X
|
IT
|
U
|
I
|
G
|
B
|
5
|
|
Oil & Gas
|
Artificial
Lift or Fracking
|
0%
|
0%
|
0%
|
0%
|
0%
|
0%
|
5%
|
26
|
13%
|
|
Refinery
|
Intake
|
5%
|
1%
|
12%
|
4%
|
0%
|
0%
|
0%
|
0%
|
0%
|
|
Refinery
|
Steam
|
8%
|
0%
|
1%
|
0%
|
1%
|
0%
|
0%
|
4
|
0%
|
|
Refinery
|
Process
|
8%
|
3%
|
1%
|
8%
|
3%
|
1%
|
0%
|
3
|
0%
|
|
Refinery
|
Wastewater
|
5%
|
3%
|
12%
|
4%
|
1%
|
0%
|
0%
|
3
|
0%
|
|
Petrochemical
|
Intake
|
5%
|
1%
|
12%
|
4%
|
0%
|
0%
|
0%
|
0%
|
0%
|
|
Petrochemical
|
Steam
|
8%
|
0%
|
1%
|
0%
|
1%
|
0%
|
0%
|
4%
|
0%
|
|
Petrochemical
|
Process
|
8%
|
3%
|
1%
|
8%
|
3%
|
1%
|
0%
|
3
|
0%
|
|
Petrochemical
|
Wastewater
|
5%
|
3%
|
12%
|
4%
|
1%
|
0%
|
0%
|
3
|
0%
|
Analysis
by pump type can include designs where there are only 10-20 suppliers such
as hydraulically balanced diaphragm pumps, designs such as external gear
pumps with hundreds of suppliers or centrifugal pumps with thousands of
suppliers.
|
External Gear Pump Market Shares
83 companies analyzed
|
|
Pump Company
|
Total Corporation Pump
Sales, Mil $/Yr
|
% of Total Pump Sales
|
External Gear Pump Sales, Mil $/Yr
|
% of External Gear Pump Sales
%
|
Major Applications for EGP
|
|
AB
|
$6.0
|
0.010
|
$1.0
|
0.156
|
Machinery Lubrication
|
|
AL
|
$16.0
|
0.026
|
$9.0
|
1.406
|
Machinery Lubrication
|
|
ALC
|
$6.0
|
0.010
|
$1.0
|
0.156
|
Machinery Lubrication
|
|
AS
|
$1.5
|
0.002
|
$1.0
|
0.156
|
Machinery Lubrication
|
|
B
|
$45.0
|
0.075
|
$3.0
|
0.469
|
General
|
|
Bos
|
$18.0
|
0.030
|
$7.0
|
1.094
|
General
|
|
Bow
|
$6.0
|
0.010
|
$6.0
|
0.937
|
General
|
|
CA
|
$50.0
|
0.083
|
$4.0
|
0.625
|
Machinery Lubrication
|
|
Co
|
$640.0
|
1.060
|
$50.0
|
7.812
|
Machinery Lubrication &
Fuel Transfer
|
|
Cor
|
$1.0
|
0.002
|
$1.0
|
0.156
|
General
|
|
Cu
|
$2.0
|
0.003
|
$2.0
|
0.312
|
General
|
|
DEL
|
$20.0
|
0.033
|
$10.0
|
1.562
|
General
|
|
DELT
|
$5.0
|
.008
|
$2.0
|
0.312
|
Machinery Lubrication &
Fuel Transfer
|
|
DO
|
$19.0
|
0.032
|
$3.0
|
0.469
|
General
|
Pumps: World
Markets has the
50,000 basic forecasts to which customized analyzes can be easily added http://home.mcilvainecompany.com/index.php/markets/water-and-flow/n019-pumps-world-market
. Bob Mcilvaine can answer your
questions at rmcilvaine@mcilvainecompany.com Direct 847 784 0012 cell 847 226 2391
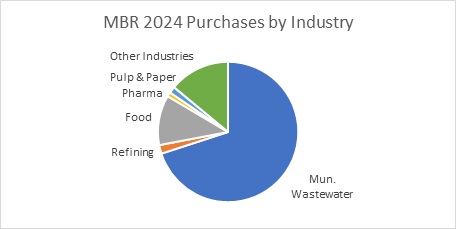
MBR Market to
Exceed $5 billion in 2024
The
market for membrane bioreactor systems will exceed $5 billion in 2024 with
more than $3 billion accounted for by wastewater treatment. This is the new forecast by the Mcilvaine
Company in http://home.mcilvainecompany.com/index.php/markets/water-and-flow/n020-ro-uf-mf-world-market.
This
material is being added as a separate segment of the RO/UF/MF service due
to the large size of the microfiltration and ultrafiltraton revenues
associated with this application.
The forecast is unique in that the revenues represent the aggregate
of what would be reported in financial statements by suppliers. This approach is preferred because
· It is the only way to iterate hard
numbers with statistical determinations
· It reflects the revenues of the
companies pursuing the MBR market
It
includes revenues of suppliers such as Suez and Beijing Origin but just for
their initial contract and not for operation revenues. In cases where the
MBR is an upgrade to existing biological treatment, the upgrade portion is
reflected. In some recent contracts the upgrade value was only 50% of a
greenfield complete system.
In
cases where there is no identifiable MBR system contractor only the
revenues for the MBR components are included. If the broader definition of
MBR installed cost were to be the criteria the market in 2024 would
exceed $7 billion.
The
report includes detailed analysis of system suppliers. In the coming months market shares for
membrane suppliers will also be added to the report.
For
more information contact Bob McIlvaine at
847 226 2391
|