|
WELCOME
Weekly selected highlights in flow control, treatment and combustion from the many McIlvaine publications.
Forecasting the Most Profitable Market - Kemira Example
Wet FGD: Most Profitable Markets
By Bob McIlvaine, President of McIlvaine Company and former President of Environeering
Wet calcium based FGD systems treat more hot gas than all the other air pollution acid gas removal systems combined. There are 2 million MW of installed systems. These systems clean 7 billion cubic feet per minute of exhaust gas. The average installed cost was $200,000/MW resulting in a cumulative investment of over $400 billion. The O&M, consumables and replacement market exceeds $50 billion per year. The capacity growth rate has slowed to 1%/yr. This is due to a combination of 1% retirements in the West, more than offset by a 2% growth rate of new plants in Asia and elsewhere. New construction is averaging 30,000 MW per year. The market will grow over the next 10 years regardless of greenhouse gas initiatives. Some countries in Asia with indigenous coal and no natural gas have no other choice than to install coal-fired power plants if they want to grow their economies in the next decade.
In 1965 I was sales manager of Environeering. The company sold scrubbers and turnkey systems to foundries, chemical, pulp and paper and mining companies. I received a call from Jim Jonakin of Combustion Engineering (CE) explaining that we had been chosen as the partner to pursue the power plant FGD market. In 1968 I had become president of Environeering. The company designed and built the scrubbers to be installed for the world’s first commercial size wet limestone system at Union Electric Merrimac station. Shortly thereafter Environeering became a subcontractor to United Engineers who installed the first magnesium oxide sulfur recovery systems. The partnership with CE continued for several years and included systems at Louisville Gas and Electric, Northern States Power, and other utilities.
In 1972 Environeering was sold to Riley who eventually became Babcock Power. I managed the environmental subsidiary and was involved in the systems under design for Central Illinois Light Company and South Mississippi Power.
In 1974 I founded the McIlvaine Company whose first product was a manual and newsletter on FGD. The initial purpose was to help power plants with FGD maintenance issues. This was before the creation of EPRI, so there was no alternative source for guidance. The FGD publications have continued with over 500 monthly updates during the 45 years. The focus expanded to include market reports as well as merger and acquisition advice. I have had the unique opportunity to examine financial statements of many private as well as public companies which were involved in M&A endeavors.
I can look back and see that the biggest cause of problems for FGD system and component suppliers was the focus on revenues rather than profits. This problem in turn is caused by the easy access to forecasts for revenue but not profits. To rectify this problem McIlvaine Company is creating Most Profitable Market (MPM) forecasts.
McIlvaine is offering a service to help suppliers quantify the market in terms of the obtainable gross profit at various prices levels resulting in the revenue and gross margin combination toprovide the Most Profitable Market (MPM). This is defined as the market for which the supplier can most profitably supply its products and services given its capital and knowledge resources.
Total Available Market (TAM) for new systems is $6 billion/yr. The O&M, parts, replacement and reagent cost is $50 billion/yr. This includes O&M presently supplied by the plant and not a third party contractor. The Serviceable Obtainable Market (SOM) is the market that can be addressed with the lowest priced product at even small unit margins. This market is $20 billion per year. The MPM for an individual supplier is a much smaller percentage. However, it is not impossible that one supplier with remote monitoring, process management software could generate revenue of $2 billion.
In the 1980s Mitsubishi and Air Products and Chemicals formed Pure Air. They contracted with NIPSCO to install and operate an FGD system at the Bailey station. NIPSCO made no capital investment. It paid Pure Air an agreed amount for every ton of SO2 captured. Some years later Air Products revealed that the enterprise had been very profitable.
MET sold an ammonia scrubbing system to a North Carolina utility on the same basis of payment per ton of SO2 captured. In this case, with ammonia as the scrubbing liquor, MET would also generate revenue from ammonium sulfate sales. Soon after the order was received, MET issued a press release showing EBITA projections of over $100 million during the life of the contract. (The order was canceled for unrelated reasons a few months later). There is still an opportunity for sale of products other than gypsum. One option is sulfuric acid another is hydrochloric acid. A variation of this design is the sale of rare earths.
News Release: HCl Scrubbing and Rare Earth Recovery from Coal-fired Power Plants and Gasifiers are the Perfect Marriage
The major problem for system suppliers is pursuit of revenues and not high gross margins. This mindset discourages R&D. Environeering discovered that a rod deck scrubber with its turbulent action was much more cost effective than spray tower designs. It tried to persuade Combustion Engineering of the advantages but was told that no innovations would be considered. The spray tower design originated because of all the plugging of more efficient scrubbers. The only advances over the years have been minor improvements in this very inefficient approach. Riley had two successful rod deck installations when it became part of Deutsche Babcock. The acquirer had a spray tower design and didn’t want to consider switching to the rod decks.
Combustion Engineering allocated $25 million to develop FGD scrubbing in 1965. A 10,000 cfm Environeering scrubber was installed at CE Kreisinger labs in Windsor Connecticut. For several years R&D was conducted with sufficient funding. However, with the first commercial installation the R&D funding disappeared. Mitsubishi (now MHPS) has spent a considerable amount on R&D. They are an exception in the industry. However, I would question as to how much of this is pure R&D and how much is just engineering improvements. Mitsubishi installed a full size scrubber in its research facilities. I would contend that this is very valuable in improving spray patterns and other engineering aspects. However, instead of a 400,000 cfm unit, I would argue that a 1000 cfm unit is the ideal size to try most innovations.
At the time Environeering was acquired by Riley, it was operating a liquid encapsulation scrubber pilot unit at Tampa Electric. The scrubber used a principle similar to the toy soap bubbler. The slurry and flue gas were converted into a toothpaste-looking foam. Soak time was variable depending on the chosen ductwork length. The mass transfer characteristics are thousands of times higher than a packed tower. A mechanical foam breaker then separated the gas and liquid. The problem was that it was only 99.9 % reliable. This meant that 0.1% of the time a full size scrubber could be emitting 4 million cubic feet of foam per minute. So work was underway to make the system 100% reliable. However, the chairman of Riley interceded soon after the acquisition to cancel this research. EPA saw the merits and funded its own study. However, it was unable to duplicate a design, which had been under development for a decade. Therefore this promising technology has not been pursued since.
Why has the FGD industry not invested more in R&D? The answer is because the markets in any one country have been volatile. The FGD market in the U.S. boomed for only a short time. It then boomed in Japan and Europe for a short time. More recently it boomed in China but the market there has now receded. The Indian market is being pursued by companies such asBHEL which is using the same old spray tower designs that have been around since the 1980s.
Huge upgrade potential. With $50 billion being spent on maintaining the existing systems, which rely on technology developed in the 1960s, there is a big opportunity for suppliers with better products and approaches. Due to new environmental regulations at many plants, there is the potential for major projects. Chinese power plants have added tail end wet precipitators to meet tough new emission standards. The rod deck takes up a small space. A spray tower can be converted to a rod deck in the bottom portion and the WESP in the top portion.
The original FGD systems also removed particulate. Dravo Lime (now Carmeuse) used venturi scrubbers (similar in principle to the rod deck but takes more space) to capture both particulate and SO2. Natural oxidation rather than forced oxidation is combined with sludge fixation to create impermeable aggregate (no mercury leaching), which was used in parking lots or landfill. The cost of these systems, even with a back end wet precipitator, are much lower than forced oxidation, spray tower, and gypsum systems with toxic metal cleanup.
The combination of an existing precipitator plus the Dravo Lime design can meet the particulate regulations. The system has proven to reduce the particulate emissions from the precipitator by 50%. There are a number of cases where wet lime rather than limestone gypsum would provide the lowest total cost of ownership. Lime is much more reactive and requires a much smaller capital investment. Lime can also result in a very high purity gypsum, which is superior to precipitated calcium carbonate as a magazine paper coating.
Components: Suppliers of components with lower total cost of ownership can penetrate all the countries. Gardner Denver made a convincing case that their oxidation blower had the lowest cost of ownership and received an order in China despite higher first cost. There are many components such as pumps, valves, nozzles, hydrocyclones, and belt filters subjected to the abrasive slurries. Most of these purchases are being made by very large utilities who increasingly are using data analytics, centralized purchasing and total cost of ownership analyses to make decisions.
Remote O&M and IIoT: System and component suppliers have the opportunity to provide yearly contracts to cover replacement, repairs and service. Presently some valves may be opened routinely whether or not there is a problem. Other valves are not opened when they should be. In both cases there is an added cost to the operator. With remote monitoring, maintenance and guidance, the overall cost can be reduced. The plant and the supplier can split the yearly savings.
Summary: There is a substantial profit opportunity in the wet FGD market. Suppliers of systems, consumables, and components should obtain forecasts of the Most Profitable Market(MPM) for their products in each region but also with each of the major utilities The MPM is derived from the SOM, which is provided in N027 FGD Market and Strategies. McIlvaine will assist in determining what portion of SOM at what pricing and packaging strategy constitutes the MPM. Part of the analysis will be to determine the cost of ownership of all the options. This in turn will be based on decades of evidence gathered in 44I Coal Fired Power Plant Decisions.
The MPM forecast of purchases by each owner is also available. A small number of utilities operate most of the systems. Forecasts for each owner and for each plant within a system are available based on data extracted from 42EI Utility Tracking System.
For more information contact Bob McIlvaine at rmcilvaine@mcilvainecompany.com 847 226 2391
Achieving the Most Profit from Valve Sales
Management of valve companies continually analyze and predict future profitability. Unit margins have to be sufficient to exceed cost of goods sold by an amount sufficient to cover selling and administrative expense by the targeted operating margin. In 2018 Crane cost of goods sold was 64% of sales, gross profit was 36%. Income before taxes was 12%.
|
Category
|
Crane
|
Flowserve
|
IMI
|
Metso Flow
|
|
|
$
|
%
|
$
|
%
|
$
|
%
|
$
|
%
|
|
Net Sales
|
3345
|
100
|
3832
|
100
|
1907
|
100
|
720
|
100
|
|
Cost of Sales
|
2156
|
64
|
2644
|
69
|
|
|
|
|
|
Gross Profit
|
1189
|
36
|
1187
|
31
|
|
|
|
|
|
Selling and General Expense
|
721
|
22
|
943
|
25
|
|
|
|
|
|
Income before Tax
|
411
|
12
|
176
|
5
|
251
(OP}
|
13
|
117
(OP)
|
16
|
|
Taxes
|
76
|
2
|
51
|
1
|
|
|
|
|
|
Net Income
|
335
|
10
|
119
|
3
|
|
|
|
|
Flowserve COGS and selling and general expenses were higher than Crane. IMI income was 13% of sales
Metso income in their flow division was $117 million which is 16% of sales.
In 2018 the Flowserve income before taxes was 5% which is significantly lower than that of Crane. This is an example of how profitability per sales dollar can vary considerably company to company. Flowserve has a history of innovation which should result in high profit margins. The company has focused on oil and gas to a greater extent than Crane. Flowserve has suffered from the downturn in several of its key markets.
The net margins for Flowserve in the next several years should be much higher due to the expanding oil and gas market and the amount of infrastructure Flowserve has created to address it. So some of the expenses in 2018 and prior years will put Flowserve in a position to supply products with a Lower Total Cost of Ownership (LTCO) advantage.
Companies spend much more time and effort predicting various expenses than on analyzing profitable markets. Income is a direct result of profitable sales. The connection between the two needs to be quantified. This is being achieved with a new tool: Most Profitable Market (MPM).
The goal of valve companies is to maximize profits. Market forecasts should be the foundation of the business strategy. Instead they are usually treated as a peripheral tool. The reason is that market forecasts typically quantify the Total Available Market (TAM) which includes geographies and product requirements which cannot be served. The reports are customized at some expense to provide the Serviceable Obtainable Market (SOM) which reflects a market which can be served at some profit margin even if meager.
Management does not want to be chasing orders which have meager unit margins when there are opportunities with high margins. By creating the Most Profitable Market (MPM) forecast they create a very valuable foundation for the whole business program.
The MPM is defined as the market which yields the highest profit given the resources and knowledge available.
This market is some fraction of the SOM. The MPM can further be defined as the market where the company has the lowest total cost of ownership (LTCO) at an attractive profit margin. The MPM is further restricted to those opportunities where Lowest Total Cost of Ownership Validation (LTCOV) can be demonstrated.
The MPM is calculated based on the targeted market share. The biggest potential target in the U.S. oil and gas industry is light tight oil (LTO) extracted through hydraulic fracturing of shale. The 2018 forecast for Light Tight Oil production in 2023 by IEA was 7 million bl/d. The latest estimate by McIlvaine for light tight oil production is 15 million b/d.
|
U.S. Valve Sales in the Oil and Gas Industry in 2023
|
|
Liquid Source
|
mb/d
|
SOM Valve Sales 2023 $ millions
|
|
LTO ( hydraulic fracturing)
|
15
|
1852
|
|
Gulf of Mexico
|
1
|
123
|
|
Natural gas liquids
|
6
|
741
|
|
Alaska
|
0.3
|
37
|
|
Other
|
2
|
247
|
|
Total
|
24.3
|
3000
|
The $1.8 billion Light Tight Oil valve opportunity involves mostly critical and severe service applications. Cameron claims that its frac sand gate valves have three times the uptime of competitor designs. When you consider downtime, labor, and repair part costs the difference in total cost of ownership could be substantial. Prices can be raised to reflect the LTCO. Cameron has an easy route to LTCOV as a division of Schlumberger, one of the largest oil field suppliers.
Flowserve has been preparing for a big light tight oil market and the related oil and gas transport for more than a decade. In 2012 John Lenander, vice president of oil and gas valves (now President of Flow Control for Flowserve) said timing depends on the level of specialization, the amount of valves needed, and pipe size. For example, 10 valves for 200 miles of 42-inch pipe could be supplied in six to eight months. But 60 valves for 1,200 miles of 42-inch pipe would more likely be quoted with partial deliveries starting in six months, with everything completed in about a year.
“We’ve been putting a lot of additional resources into supply-chain management, project management and engineering,” he said. At the time Flowserve also was expanding plant capacity. So by identifying the MPM market but being off in timing Flowserve likely depressed profit margins over last few years but could more than compensate in the next decade.
Valve companies will want to use the MPM tool to address both the current and future market. This iterative process starts with management establishing profit goals. MPM is then established to achieve these goals based on market penetration and unit margins. This is an interactive process which involves assessment of product capabilities in comparison to competitors. It involves analysis of the MPM for individual large customers. Chevron and ExxonMobil have announced very large investments in light tight oil recently. The valve company has to assess its ability to achieve LTCOV for its products with each of the major oil companies. This requires input from the sales people dealing with these companies. It also involves detailed process knowledge. With the completion of iterative process the MPM becomes the foundation of the company business program.
N028 Industrial Valves: World Market provides the Total Available Market. MPM will be derived from TAM. This report has details by valve type, industry and country. It also has TAM forecasts for the largest 200 purchasers. This detailed TAM information can be then used to construct the MPM. MciIvaine can work with valve suppliers to help them create the optimum MPM using the TAM information in the valve report but also the TAM information appearing in industry market reports such as N049 Oil, Gas, Shale and Refining Markets and Projects, Hydraulic Fracturing MPM, N6F World Cleanroom Markets, N027 FGD Market and Strategies and other market reports listed at http://home.mcilvainecompany.com/index.php/markets
The MPM for individual prospects can be created with use of N032 Industrial Plants and Projects, 62EI North American Municipal Wastewater Treatment Facilities and People Database, 67EI North American Public Water Plants and People, 42EI Utility Tracking System, 31I Renewable Energy Update and Projects, 80A World Cleanroom Projects, 59EI Gas Turbine and Reciprocating Engine Supplier Program, and 44I Coal Fired Power Plant Decisions
For more information on MPM contact Bob McIlvaine at rmcilvaine@mcilvainecompany.com or call him at 847 226 2391.
Forecasting the Most Profitable Market - Kemira Example
The McIlvaine Water & Wastewater Treatment Chemicals: World Markets forecasts a market of $30 billion next year of which municipal wastewater is $5 billion. Pulp and Paper and Oil & Gas forecasts are more modest. They exclude some of the products supplied by the treatment chemical companies but which involve processes and not typical water treatment. This continuously updated report with 50,000 forecasts is arguably the best source for a multi-client estimate of the Total Available Market (TAM). However this should be only the starting point in preparation of the Most Profitable Market (MPM). This is the market which will yield the biggest profit given the supplier’s capabilities. For more details on the program Click Here
This market is impacted by new developments such as proppants for hydraulic fracking. It is impacted by product quality and cost. An important element is validation of a lower total cost of ownership (LTCOV) in the minds of purchasers. Kemira will be used as an example of how to create the MPM. Two of the most challenging aspects are to
1. Accurately assess the big new opportunities e.g. phosphorous removal, hydraulic fracturing and total solutions
2. Create a validation path which is economically effective
Kemira Assessment
Kemira sales in 2018 were € 2.6 billion. EBITA was € 323 million for a margin of 12.5%. Net profit was € 95 million. 41% of the sales were outside pulp and paper but the other 59% were in pulp and paper. Some of the largest customers are municipalities such as Shanghai, Paris, London and New York. Other major customers are oil field suppliers such as Haliburton and Schlumberger. International Paper is also a customer.
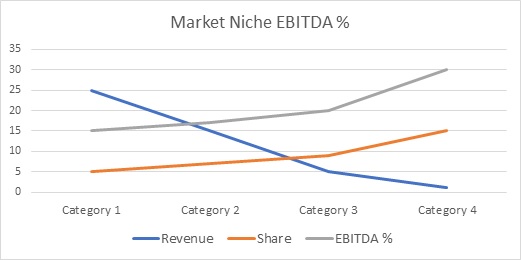
Kemira expects increased demand in water treatment chemicals due to water reuse and phosphorous recovery from wastewater. Revenue growth has averaged 3% over the last 5 years while the EBITA CAGR has been above 5%.
Five products each account for more than 15% of revenue.
Kemira has large market shares in both water treatment and oil and gas.
It estimates its pulp and paper market share at 16%. This puts it in second place behind Solenis. Kemira is looking to the oil and gas market including shale and EOR to be a contributor to profitability improvement. It is expanding polymer capacity in the U.S. A Chemical Enhanced Oil Recovery (CEOR) polymer expansion is underway in the Netherlands with a start up in the second half of 2019. Shale fracking accounts for 65 % of the oil and gas revenues with 20% in oil sands and CEOR.
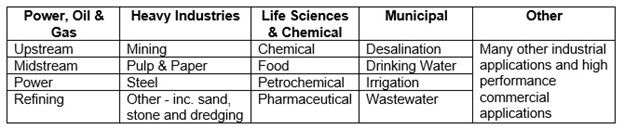
The raw materials, intermediates, products and end uses are shown below.
Opportunity #1 Hydraulic Fracking
In Hydraulic Fracturing Markets McIlvaine is predicting a big change to the previous forecasts for treatment chemicals. ExxonMobil and Chevron are planning to invest heavily in shale fracturing. The result will be twice the chemical consumption which was derived from IEA and OPEC forecasts. U.S. liquids production will reach 25 million b/d in 2025 in the new scenario. There is reason to believe that polymer chemical investment per barrel will also rise. Since Kemira is targeting this market it will be critical to make detailed assessments of the purchases in the U.S. and also in the developing markets such as Argentina. The Hydraulic Fracturing Market report Hydraulic Fracturing MPM and N026 Water and Wastewater Treatment Chemicals: World Market plus day to day coverage in N049 Oil, Gas, Shale and Refining Markets and Projects will provide insights to make this forecast more accurate.
Opportunity 2 Total Solutions
Kemira KemConnectTM gives full visibility to chemistry applications, 24/7. Because it
constantly gathers data it supplies up-to-date insights needed for better decision making, faster troubleshooting, smarter chemical management, and improved cost efficiency.
Kemira’s has provided a remote plant operation solution.to Nestlé Puljonki. This food manufacturer in Finland uses a dissolved air flotation process to pre-treat the wastewater from production before it is passed on for further treatment at the on-site plant. The sludge generated by the treatment process is dried in a screw press.
In January 2018 Kemira assumed responsibility for managing the wastewater treatment plant, while the customer was responsible for operation and monitoring with support from Kemira experts. After planning and implementing upgrades to the plant automation, the groundwork was in place for Kemira to assume full responsibility for the remote management of the wastewater treatment process at Nestlé Puljonki.
For a fixed monthly fee, Kemira takes care of all aspects relating to the operation, management, and support of the wastewater treatment process through the Kemira Operon turnkey service concept, which is based on specific key performance indicators agreed together with the customer. Using Kemira’s KemConnect platform, all relevant performance parameters at the plant can be monitored in real time by experts at Kemira’s Lapinlahti control center over 150 kilometers away.
Kemira has the potential to generate billions of dollar in revenues with this total solutions approach. More importantly it could double EBITA. This opportunity including recorded webinars with Kemira and other chemicals companies is covered in N031 Industrial IOT and Remote O&M. The webinar with a presentation by Kemira and other chemical producers is available at https://www.youtube.com/watch?v=YD5C93c6ujw&feature=youtu.be
Opportunity # 3 Phosphorous Removal
Struvite formation is a common challenge for wastewater treatment plants that utilize anaerobic sludge digestion. At the Miami-Dade plant, heavy struvite build-up had continued for years and it was starting to cost them more time and money. It impeded their dewatering operation and forced them to clean their systems on a weekly basis. This was time-consuming, resource hungry, and caused unnecessary downtime. Worse, the struvite was also damaging their centrifuges, leading to frequent repairs and yet more downtime.
Their approach was not only to apply the right chemical but to work with the customer for a complete value-adding solution,” explains Tafadzwa “Tee” Mariga, Application Manager at Kemira. Kemira’s team recognized quickly that the amount of ortho-phosphorus in the sludge needed to be decreased. Utilizing wastewater treatment expertise, the right solution was identified through laboratory testing.
The solution was based on Kemira’s enhanced solids management program, powered by KemConnect™ real-time process monitoring and performance optimization.
McIlvaine tracks the individual wastewater plant activity in 62EI North American Municipal Wastewater Treatment Facilities and People Database which is being expanded for international coverage. This information provides a detailed bottoms up market assessment as well as a vehicle to validate the lowest total cost of ownership by Kemira or a competitor.
Creating a Validation Path which is Economically Effective
The Most Profitable Market only includes real revenue opportunities. This means not only creating products with lowest total cost of ownership but continually validating their superiority. This validation in turn requires evidence and a way to organize the evidence and communicate it to the purchaser. The McIlvaine thesis is that there is enough evidence available from on line sources and it can be readily organized to provide the validation. As an example McIlvaine selected the “struvite” subject and used the WEFTEC conference last fall to show that an attendee armed with the available evidence could attend the show and make decisions at a very high level. The approach was chronicled in Municipal Wastewater Services.
An update was sent to potential attendees with the struvite focus Municipal Wastewater Treatment Update. This update linked to many articles already available on line about struvite from specific exhibitors including consultants, separation and pump companies. It identified available articles on struvite from each of the publishers who was exhibiting. It included abstracts of speeches to be given at WEFTEC. Phosphorous recovery is an option being pursued by some plants. So this impacts the market for chemicals. The extent of struvite problems with pumps and centrifuges helps quantify the value of a chemical to solve the problem.
So just gathering the evidence available at one event demonstrates how a company such Kemira can validate a LTCO product.
The Most Profitable Market forecast can be the foundation of the business program. The MPM includes the impact of R&D and product improvement to lower cost of ownership. It includes the intelligence from the sales department on competitor designs and market share. It can be used to set realistic targets for regional sales directors and even the local salesmen. Since these chemicals are continuously consumed, the purchases at each plant can be predicted. The program is a systematic route to maximize profits.
For more information contact Bob McIlvaine at 847 784 0012 ext. 122 or by cell at 847 226 2391 or by email rmcilvaine@mcilvainecompany.com
|