Agenda - Application of U.S. Mercury Control Technology
In other Countries
1. Is there a need?
2. Will legislation drive the need?
3. Does the U.S. have exportable technology
4. How can this be exported
1. Is there a need?
a. Utility Industry
Coal-Fired Power MW Forecast
(Megawatts)
|
World Region |
2014 |
2015 |
2016 |
2017 |
2018 |
2019 |
|
- Select All |
2,022,225.40 |
2,105,080.60 |
2,220,631.00 |
2,334,294.80 |
2,458,990.80 |
2,578,249.20 |
|
Africa |
53,168.00 |
58,768.00 |
64,336.00 |
69,071.00 |
72,686.00 |
73,686.00 |
|
CIS |
91,144.00 |
91,744.00 |
92,504.00 |
93,554.00 |
94,934.00 |
95,554.00 |
|
East Asia |
1,053,284.00 |
1,139,239.00 |
1,232,039.00 |
1,321,694.00 |
1,406,644.00 |
1,489,084.00 |
|
Eastern Europe |
69,553.00 |
72,303.00 |
74,478.00 |
78,878.00 |
81,728.00 |
85,378.00 |
|
Middle East |
25,426.00 |
26,056.00 |
27,056.00 |
28,306.00 |
29,556.00 |
31,006.00 |
|
NAFTA |
336,508.40 |
313,325.60 |
308,949.00 |
306,626.80 |
305,480.80 |
303,881.20 |
|
South & Central America |
12,863.00 |
13,293.00 |
13,993.00 |
14,931.00 |
16,371.00 |
17,811.00 |
|
West Asia |
184,932.00 |
198,432.00 |
218,157.00 |
235,457.00 |
267,457.00 |
299,157.00 |
|
Western Europe |
195,347.00 |
191,920.00 |
189,119.00 |
185,777.00 |
184,134.00 |
182,692.00 |
b. Industrial Boilers
The Chinese Market is much bigger than the U.S. At the end of 2011, there were about 620,300 boilers in use; 9,700 are utility boilers used for power generation, 610,600 sets are industrial boilers. The coal-fired boilers account for 85 percent, or 527,000 units.
Coal consumption of total industrial boilers is 0.72 billion tons per year. THIS IS NEARLY EQUAL TO THE AMOUNT BURNED IN U.S. UTILITY BOILERS. The dust, SO2 and NOx emissions are 1.6, 7.18, 2.71 million tons per year respectively.
c. List of Total Number and Capacities from 1998 to 2020
|
|
TOTAL VALUE |
||
|
YEAR |
Set 104 |
Capacities 104MWh |
|
|
1998 |
50.1 |
|
|
|
2002 |
57.26 |
199.49 |
|
|
2003 |
56.24 |
202.36 |
|
|
2004 |
57.27 |
181.79 |
|
|
2005 |
55.38 |
|
|
|
2006 |
54.3 |
211.97 |
|
|
2007 |
53.41 |
333.56 |
|
|
2008 |
57.82 |
356.34 |
|
|
2009 |
59.52 |
334.6 |
|
|
2010 |
60.73 |
|
|
|
2011 |
62.03 |
351.29 |
|
|
2015 |
67.0 |
400 |
|
|
2020 |
72.0 |
450 |
|
|
|
|
|
|
Cement Comparative
Production by Country
with the World in 2010 At 1005
|
COUNTRY |
2012 |
2013 |
2014 |
2015 |
2016 |
2017 |
2018 |
2019 |
||||
|
United States |
3.22 |
3.30 |
3.37 |
3.45 |
3.53 |
3.62 |
3.73 |
3.83 |
||||
|
Canada |
0.49 |
0.50 |
0.51 |
0.52 |
0.53 |
0.55 |
0.56 |
0.57 |
||||
|
Mexico |
1.83 |
1.90 |
1.97 |
2.03 |
2.11 |
2.19 |
2.28 |
2.37 |
||||
|
Argentina |
0.42 |
0.43 |
0.44 |
0.45 |
0.47 |
0.49 |
0.50 |
0.52 |
||||
|
Brazil |
3.54 |
3.59 |
3.74 |
3.90 |
4.07 |
4.26 |
4.47 |
4.69 |
||||
|
Chile |
0.22 |
0.23 |
0.24 |
0.25 |
0.26 |
0.28 |
0.29 |
0.31 |
||||
|
Colombia |
0.48 |
0.50 |
0.53 |
0.55 |
0.58 |
0.62 |
0.65 |
0.69 |
||||
|
Ecuador |
0.00 |
0.00 |
0.00 |
0.00 |
0.00 |
0.00 |
0.00 |
0.00 |
||||
|
Guatemala |
0.00 |
0.00 |
0.00 |
0.00 |
0.00 |
0.00 |
0.00 |
0.00 |
||||
|
Peru |
0.25 |
0.27 |
0.28 |
0.30 |
0.32 |
0.34 |
0.36 |
0.38 |
||||
|
Venezuela |
0.37 |
0.39 |
0.39 |
0.40 |
0.40 |
0.41 |
0.41 |
0.42 |
||||
|
Other South & Central America |
0.16 |
0.16 |
0.16 |
0.17 |
0.17 |
0.17 |
0.18 |
0.18 |
||||
|
Austria |
0.11 |
0.11 |
0.11 |
0.11 |
0.11 |
0.11 |
0.12 |
0.12 |
||||
|
Belgium |
0.10 |
0.10 |
0.10 |
0.10 |
0.10 |
0.10 |
0.10 |
0.10 |
||||
|
Denmark |
0.10 |
0.09 |
0.10 |
0.10 |
0.10 |
0.10 |
0.10 |
0.11 |
||||
|
Finland |
0.04 |
0.04 |
0.04 |
0.04 |
0.04 |
0.04 |
0.04 |
0.04 |
||||
|
France |
0.75 |
0.75 |
0.75 |
0.75 |
0.75 |
0.76 |
0.76 |
0.76 |
||||
|
Germany |
1.49 |
1.50 |
1.52 |
1.54 |
1.57 |
1.60 |
1.63 |
1.66 |
||||
|
Greece |
0.48 |
0.45 |
0.43 |
0.40 |
0.38 |
0.36 |
0.34 |
0.32 |
||||
|
Ireland |
0.11 |
0.11 |
0.11 |
0.11 |
0.11 |
0.11 |
0.12 |
0.12 |
||||
|
Italy |
1.33 |
1.30 |
1.27 |
1.25 |
1.24 |
1.24 |
1.23 |
1.22 |
||||
|
Netherlands |
0.10 |
0.10 |
0.10 |
0.10 |
0.10 |
0.10 |
0.10 |
0.10 |
||||
|
Norway |
0.08 |
0.08 |
0.09 |
0.09 |
0.09 |
0.10 |
0.10 |
0.10 |
||||
|
Portugal |
0.10 |
0.10 |
0.10 |
0.10 |
0.10 |
0.10 |
0.10 |
0.10 |
||||
|
Spain |
1.11 |
1.09 |
1.08 |
1.09 |
1.11 |
1.13 |
1.16 |
1.18 |
||||
|
Sweden |
0.11 |
0.11 |
0.12 |
0.12 |
0.13 |
0.13 |
0.14 |
0.14 |
||||
|
Switzerland |
0.12 |
0.12 |
0.12 |
0.12 |
0.12 |
0.12 |
0.13 |
0.13 |
||||
|
Turkey |
0.48 |
0.48 |
0.48 |
0.48 |
0.48 |
0.49 |
0.49 |
0.49 |
||||
|
United Kingdom |
0.00 |
0.00 |
0.00 |
0.00 |
0.00 |
0.00 |
0.00 |
0.00 |
||||
|
Other Western Europe |
0.06 |
0.06 |
0.06 |
0.07 |
0.07 |
0.07 |
0.07 |
0.07 |
||||
|
Bulgaria |
0.25 |
0.25 |
0.25 |
0.25 |
0.26 |
0.26 |
0.27 |
0.27 |
||||
|
Czech Republic |
0.85 |
0.84 |
0.87 |
0.91 |
0.95 |
0.99 |
1.03 |
1.08 |
||||
|
Hungary |
1.15 |
1.18 |
1.20 |
1.23 |
1.26 |
1.29 |
1.33 |
1.37 |
||||
|
Poland |
0.48 |
0.49 |
0.49 |
0.50 |
0.50 |
0.51 |
0.52 |
0.53 |
||||
|
Romania |
0.18 |
0.18 |
0.19 |
0.19 |
0.20 |
0.20 |
0.21 |
0.21 |
||||
|
Slovakia |
0.27 |
0.27 |
0.27 |
0.27 |
0.26 |
0.26 |
0.26 |
0.26 |
||||
|
Other Eastern Europe |
0.00 |
0.00 |
0.00 |
0.00 |
0.00 |
0.00 |
0.00 |
0.00 |
||||
|
Belarus |
0.00 |
0.00 |
0.00 |
0.00 |
0.00 |
0.00 |
0.00 |
0.00 |
||||
|
Kazakhstan |
0.89 |
0.92 |
0.94 |
0.97 |
1.01 |
1.04 |
1.08 |
1.12 |
||||
|
Russia |
0.17 |
0.17 |
0.17 |
0.18 |
0.19 |
0.19 |
0.20 |
0.21 |
||||
|
Ukraine |
0.00 |
0.00 |
0.00 |
0.00 |
0.00 |
0.00 |
0.00 |
0.00 |
||||
|
Uzbekistan |
0.02 |
0.02 |
0.02 |
0.02 |
0.02 |
0.02 |
0.03 |
0.03 |
||||
|
Other CIS |
0.00 |
0.00 |
0.00 |
0.00 |
0.00 |
0.00 |
0.00 |
0.00 |
||||
|
Algeria |
0.85 |
0.86 |
0.88 |
0.90 |
0.92 |
0.95 |
0.97 |
1.00 |
||||
|
Egypt |
0.06 |
0.06 |
0.07 |
0.07 |
0.08 |
0.08 |
0.09 |
0.09 |
||||
|
Kenya |
0.00 |
0.00 |
0.00 |
0.00 |
0.00 |
0.00 |
0.00 |
0.00 |
||||
|
Libya |
0.56 |
0.57 |
0.59 |
0.61 |
0.63 |
0.65 |
0.67 |
0.70 |
||||
|
Morocco |
0.08 |
0.09 |
0.09 |
0.10 |
0.11 |
0.12 |
0.13 |
0.14 |
||||
|
Nigeria |
0.44 |
0.45 |
0.46 |
0.47 |
0.49 |
0.51 |
0.52 |
0.54 |
||||
|
South Africa |
0.20 |
0.21 |
0.21 |
0.22 |
0.22 |
0.23 |
0.24 |
0.25 |
||||
|
Tunisia |
0.05 |
0.05 |
0.05 |
0.06 |
0.06 |
0.06 |
0.07 |
0.07 |
||||
|
Other Africa |
0.00 |
0.00 |
0.00 |
0.00 |
0.00 |
0.00 |
0.00 |
0.00 |
||||
|
Iran |
0.00 |
0.00 |
0.00 |
0.00 |
0.00 |
0.00 |
0.00 |
0.00 |
||||
|
Iraq |
0.29 |
0.30 |
0.31 |
0.32 |
0.33 |
0.34 |
0.36 |
0.37 |
||||
|
Israel |
0.00 |
0.00 |
0.00 |
0.00 |
0.00 |
0.00 |
0.00 |
0.00 |
||||
|
Saudi Arabia |
0.22 |
0.22 |
0.22 |
0.22 |
0.23 |
0.23 |
0.23 |
0.23 |
||||
|
Syrian Arab Republic |
3.95 |
4.07 |
4.20 |
4.33 |
4.48 |
4.64 |
4.81 |
5.00 |
||||
|
United Arab Emirates |
0.00 |
0.00 |
0.00 |
0.00 |
0.00 |
0.00 |
0.00 |
0.00 |
||||
|
Other Middle East |
0.20 |
0.21 |
0.22 |
0.23 |
0.24 |
0.25 |
0.27 |
0.28 |
||||
|
Australia |
0.32 |
0.33 |
0.34 |
0.36 |
0.37 |
0.38 |
0.40 |
0.41 |
||||
|
China |
60.60 |
65.33 |
70.56 |
75.67 |
81.16 |
87.12 |
93.61 |
100.68 |
||||
|
Hong Kong |
0.09 |
0.10 |
0.10 |
0.10 |
0.10 |
0.10 |
0.11 |
0.11 |
||||
|
Indonesia |
1.57 |
1.67 |
1.77 |
1.89 |
2.01 |
2.15 |
2.29 |
2.46 |
||||
|
Japan |
4.25 |
4.27 |
4.30 |
4.33 |
4.37 |
4.41 |
4.47 |
4.53 |
||||
|
Malaysia |
0.67 |
0.70 |
0.74 |
0.78 |
0.82 |
0.87 |
0.92 |
0.97 |
||||
|
New Zealand |
0.00 |
0.00 |
0.00 |
0.00 |
0.00 |
0.00 |
0.00 |
0.00 |
||||
|
Philippines |
0.63 |
0.67 |
0.72 |
0.77 |
0.83 |
0.89 |
0.96 |
1.03 |
||||
|
Singapore |
0.00 |
0.00 |
0.00 |
0.00 |
0.00 |
0.00 |
0.00 |
0.00 |
||||
|
South Korea |
4.00 |
4.08 |
4.17 |
4.26 |
4.36 |
4.47 |
4.60 |
4.73 |
||||
|
Taiwan |
1.07 |
1.09 |
1.13 |
1.18 |
1.23 |
1.29 |
1.36 |
1.43 |
||||
|
Thailand |
2.58 |
2.72 |
2.85 |
3.00 |
3.16 |
3.33 |
3.52 |
3.72 |
||||
|
Vietnam |
0.00 |
0.00 |
0.00 |
0.00 |
0.00 |
0.00 |
0.00 |
0.00 |
||||
|
Other East Asia |
0.01 |
0.01 |
0.01 |
0.01 |
0.01 |
0.01 |
0.01 |
0.01 |
||||
|
Bangladesh |
0.03 |
0.04 |
0.04 |
0.04 |
0.04 |
0.05 |
0.05 |
0.05 |
||||
|
India |
9.66 |
10.14 |
10.72 |
11.15 |
11.61 |
12.11 |
12.65 |
13.23 |
||||
|
Myanmar |
0.03 |
0.04 |
0.04 |
0.04 |
0.04 |
0.05 |
0.05 |
0.05 |
||||
|
Pakistan |
0.55 |
0.57 |
0.59 |
0.62 |
0.64 |
0.67 |
0.70 |
0.73 |
||||
|
Sri Lanka |
0.05 |
0.06 |
0.06 |
0.06 |
0.07 |
0.08 |
0.08 |
0.09 |
||||
|
Other West Asia |
0.00 |
0.00 |
0.00 |
0.00 |
0.00 |
0.00 |
0.00 |
0.00 |
||||
|
TOTAL WORLD |
114.93 |
121.07 |
128.04 |
134.91 |
142.33 |
150.39 |
159.17 |
168.71 |
||||
|
29.01(6A) McIlvaine Company |
|
|
|
|
|
|
|
|
||||
|
Rev 11/22/13 |
|
|
|
|
|
|
|
|
||||
|
INCR2: Incinerator Industry - Consumables, BASE YEAR 2010 |
|
|
|
|||||||||
|
COUNTRY |
2012 |
2013 |
2014 |
2015 |
2016 |
2017 |
2018 |
2019 |
||||
|
United States |
18.00 |
18.39 |
18.80 |
19.23 |
19.71 |
20.22 |
20.79 |
21.37 |
||||
|
Canada |
1.65 |
1.68 |
1.72 |
1.75 |
1.79 |
1.84 |
1.89 |
1.94 |
||||
|
Mexico |
1.17 |
1.21 |
1.25 |
1.30 |
1.35 |
1.40 |
1.45 |
1.51 |
||||
|
Argentina |
0.49 |
0.50 |
0.52 |
0.53 |
0.55 |
0.57 |
0.59 |
0.61 |
||||
|
Brazil |
6.00 |
6.08 |
6.34 |
6.61 |
6.91 |
7.23 |
7.58 |
7.96 |
||||
|
Chile |
0.41 |
0.43 |
0.45 |
0.47 |
0.50 |
0.52 |
0.55 |
0.58 |
||||
|
Colombia |
0.86 |
0.89 |
0.94 |
0.99 |
1.04 |
1.10 |
1.16 |
1.23 |
||||
|
Ecuador |
0.08 |
0.08 |
0.09 |
0.09 |
0.10 |
0.10 |
0.10 |
0.11 |
||||
|
Guatemala |
0.13 |
0.14 |
0.14 |
0.15 |
0.15 |
0.16 |
0.16 |
0.17 |
||||
|
Peru |
0.43 |
0.46 |
0.48 |
0.51 |
0.55 |
0.58 |
0.62 |
0.66 |
||||
|
Venezuela |
0.55 |
0.58 |
0.59 |
0.60 |
0.60 |
0.61 |
0.62 |
0.63 |
||||
|
Other South & Central America |
1.12 |
1.14 |
1.16 |
1.18 |
1.21 |
1.23 |
1.26 |
1.30 |
||||
|
Austria |
0.55 |
0.55 |
0.55 |
0.56 |
0.56 |
0.57 |
0.58 |
0.59 |
||||
|
Belgium |
0.41 |
0.41 |
0.41 |
0.41 |
0.41 |
0.41 |
0.41 |
0.42 |
||||
|
Denmark |
0.39 |
0.39 |
0.40 |
0.41 |
0.41 |
0.42 |
0.43 |
0.44 |
||||
|
Finland |
0.32 |
0.32 |
0.32 |
0.32 |
0.33 |
0.33 |
0.33 |
0.34 |
||||
|
France |
3.76 |
3.77 |
3.76 |
3.76 |
3.77 |
3.78 |
3.80 |
3.83 |
||||
|
Germany |
6.50 |
6.54 |
6.64 |
6.74 |
6.85 |
6.98 |
7.12 |
7.27 |
||||
|
Greece |
0.26 |
0.25 |
0.23 |
0.22 |
0.21 |
0.20 |
0.19 |
0.18 |
||||
|
Ireland |
0.03 |
0.03 |
0.03 |
0.03 |
0.03 |
0.03 |
0.03 |
0.03 |
||||
|
Italy |
3.56 |
3.48 |
3.40 |
3.37 |
3.34 |
3.32 |
3.30 |
3.28 |
||||
|
Netherlands |
1.14 |
1.14 |
1.13 |
1.13 |
1.13 |
1.13 |
1.13 |
1.14 |
||||
|
Norway |
0.18 |
0.18 |
0.19 |
0.20 |
0.20 |
0.21 |
0.22 |
0.23 |
||||
|
Portugal |
0.22 |
0.22 |
0.21 |
0.21 |
0.21 |
0.21 |
0.21 |
0.21 |
||||
|
Spain |
2.33 |
2.30 |
2.27 |
2.29 |
2.34 |
2.38 |
2.44 |
2.49 |
||||
|
Sweden |
0.71 |
0.71 |
0.74 |
0.76 |
0.79 |
0.82 |
0.85 |
0.89 |
||||
|
Switzerland |
0.52 |
0.52 |
0.53 |
0.53 |
0.54 |
0.55 |
0.56 |
0.57 |
||||
|
Turkey |
4.34 |
4.33 |
4.33 |
4.34 |
4.36 |
4.38 |
4.41 |
4.44 |
||||
|
United Kingdom |
0.02 |
0.02 |
0.02 |
0.02 |
0.02 |
0.02 |
0.02 |
0.02 |
||||
|
Other Western Europe |
0.07 |
0.07 |
0.07 |
0.07 |
0.08 |
0.08 |
0.08 |
0.08 |
||||
|
Bulgaria |
0.55 |
0.54 |
0.54 |
0.55 |
0.56 |
0.57 |
0.58 |
0.59 |
||||
|
Czech Republic |
0.39 |
0.38 |
0.39 |
0.41 |
0.43 |
0.45 |
0.47 |
0.49 |
||||
|
Hungary |
1.45 |
1.48 |
1.51 |
1.55 |
1.58 |
1.63 |
1.67 |
1.72 |
||||
|
Poland |
0.51 |
0.52 |
0.52 |
0.53 |
0.53 |
0.54 |
0.55 |
0.56 |
||||
|
Romania |
0.06 |
0.07 |
0.07 |
0.07 |
0.07 |
0.07 |
0.08 |
0.08 |
||||
|
Slovakia |
0.31 |
0.30 |
0.30 |
0.30 |
0.29 |
0.29 |
0.29 |
0.29 |
||||
|
Other Eastern Europe |
0.10 |
0.10 |
0.11 |
0.11 |
0.12 |
0.12 |
0.13 |
0.13 |
||||
|
Belarus |
0.13 |
0.14 |
0.15 |
0.16 |
0.17 |
0.18 |
0.20 |
0.21 |
||||
|
Kazakhstan |
1.25 |
1.29 |
1.33 |
1.37 |
1.42 |
1.46 |
1.52 |
1.57 |
||||
|
Russia |
0.36 |
0.36 |
0.37 |
0.38 |
0.39 |
0.41 |
0.42 |
0.44 |
||||
|
Ukraine |
0.23 |
0.25 |
0.28 |
0.30 |
0.32 |
0.35 |
0.38 |
0.42 |
||||
|
Uzbekistan |
0.39 |
0.41 |
0.42 |
0.45 |
0.47 |
0.49 |
0.52 |
0.55 |
||||
|
Other CIS |
0.23 |
0.24 |
0.25 |
0.25 |
0.26 |
0.27 |
0.28 |
0.29 |
||||
|
Algeria |
0.91 |
0.93 |
0.95 |
0.97 |
0.99 |
1.02 |
1.05 |
1.07 |
||||
|
Egypt |
0.19 |
0.20 |
0.22 |
0.23 |
0.24 |
0.26 |
0.27 |
0.29 |
||||
|
Kenya |
0.02 |
0.05 |
0.06 |
0.06 |
0.06 |
0.07 |
0.07 |
0.07 |
||||
|
Libya |
0.26 |
0.27 |
0.28 |
0.29 |
0.30 |
0.31 |
0.32 |
0.33 |
||||
|
Morocco |
0.85 |
0.91 |
0.98 |
1.06 |
1.14 |
1.23 |
1.33 |
1.44 |
||||
|
Nigeria |
1.25 |
1.29 |
1.33 |
1.37 |
1.41 |
1.46 |
1.51 |
1.57 |
||||
|
South Africa |
0.07 |
0.08 |
0.08 |
0.08 |
0.08 |
0.09 |
0.09 |
0.09 |
||||
|
Tunisia |
0.43 |
0.45 |
0.47 |
0.50 |
0.52 |
0.55 |
0.58 |
0.61 |
||||
|
Other Africa |
0.27 |
0.26 |
0.26 |
0.26 |
0.26 |
0.26 |
0.26 |
0.26 |
||||
|
Iran |
0.30 |
0.33 |
0.37 |
0.40 |
0.45 |
0.50 |
0.55 |
0.61 |
||||
|
Iraq |
0.27 |
0.27 |
0.28 |
0.29 |
0.30 |
0.31 |
0.32 |
0.33 |
||||
|
Israel |
0.29 |
0.31 |
0.32 |
0.33 |
0.35 |
0.36 |
0.37 |
0.38 |
||||
|
Saudi Arabia |
0.19 |
0.19 |
0.19 |
0.19 |
0.19 |
0.19 |
0.19 |
0.20 |
||||
|
Syrian Arab Republic |
0.18 |
0.18 |
0.19 |
0.19 |
0.20 |
0.21 |
0.21 |
0.22 |
||||
|
United Arab Emirates |
0.06 |
0.06 |
0.07 |
0.07 |
0.07 |
0.07 |
0.08 |
0.08 |
||||
|
Other Middle East |
0.69 |
0.73 |
0.76 |
0.79 |
0.83 |
0.88 |
0.92 |
0.97 |
||||
|
Australia |
1.28 |
1.32 |
1.37 |
1.42 |
1.47 |
1.53 |
1.59 |
1.65 |
||||
|
China |
10.76 |
11.60 |
12.53 |
13.43 |
14.41 |
15.47 |
16.62 |
17.87 |
||||
|
Hong Kong |
0.41 |
0.41 |
0.42 |
0.43 |
0.44 |
0.45 |
0.46 |
0.47 |
||||
|
Indonesia |
1.97 |
2.09 |
2.22 |
2.37 |
2.52 |
2.69 |
2.88 |
3.08 |
||||
|
Japan |
6.74 |
6.77 |
6.81 |
6.86 |
6.93 |
7.00 |
7.08 |
7.18 |
||||
|
Malaysia |
0.42 |
0.44 |
0.46 |
0.48 |
0.51 |
0.54 |
0.57 |
0.60 |
||||
|
New Zealand |
0.26 |
0.27 |
0.27 |
0.28 |
0.29 |
0.29 |
0.30 |
0.31 |
||||
|
Philippines |
1.10 |
1.17 |
1.26 |
1.35 |
1.45 |
1.56 |
1.68 |
1.80 |
||||
|
Singapore |
0.16 |
0.17 |
0.17 |
0.17 |
0.17 |
0.18 |
0.18 |
0.19 |
||||
|
South Korea |
3.07 |
3.13 |
3.20 |
3.27 |
3.35 |
3.43 |
3.53 |
3.63 |
||||
|
Taiwan |
0.68 |
0.69 |
0.71 |
0.75 |
0.78 |
0.82 |
0.86 |
0.90 |
||||
|
Thailand |
1.30 |
1.37 |
1.44 |
1.51 |
1.59 |
1.68 |
1.78 |
1.88 |
||||
|
Vietnam |
0.40 |
0.42 |
0.44 |
0.46 |
0.49 |
0.51 |
0.54 |
0.57 |
||||
|
Other East Asia |
0.19 |
0.21 |
0.22 |
0.24 |
0.25 |
0.27 |
0.29 |
0.31 |
||||
|
Bangladesh |
0.39 |
0.42 |
0.44 |
0.47 |
0.50 |
0.53 |
0.57 |
0.61 |
||||
|
India |
7.94 |
8.33 |
8.81 |
9.16 |
9.54 |
9.95 |
10.39 |
10.87 |
||||
|
Myanmar |
0.37 |
0.39 |
0.42 |
0.44 |
0.47 |
0.50 |
0.54 |
0.58 |
||||
|
Pakistan |
1.92 |
1.99 |
2.06 |
2.14 |
2.23 |
2.32 |
2.42 |
2.53 |
||||
|
Sri Lanka |
0.15 |
0.16 |
0.17 |
0.19 |
0.20 |
0.22 |
0.24 |
0.26 |
||||
|
Other West Asia |
0.19 |
0.20 |
0.21 |
0.22 |
0.24 |
0.25 |
0.26 |
0.28 |
||||
|
TOTAL WORLD |
108.11 |
110.98 |
114.38 |
117.95 |
121.88 |
126.16 |
130.85 |
135.94 |
||||
|
30.02(5A) McIlvaine Company |
|
|
|
|
|
|
|
|
||||
|
|
|
|
|
|
|
|
||||||
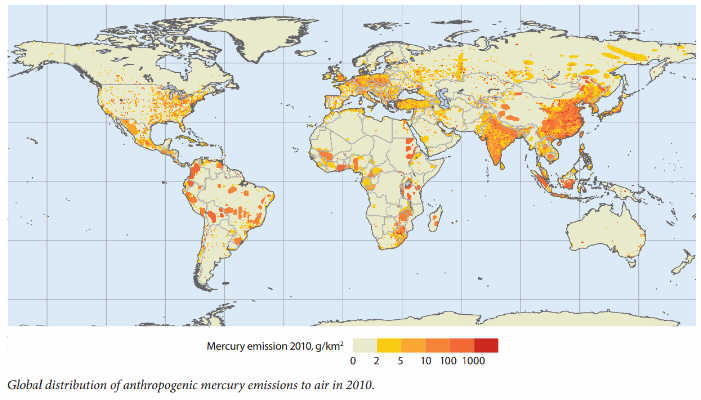
How much mercury is emitted worldwide each year? Recent estimates of annual global mercury emissions from both natural and anthropogenic sources are in the range of 5,000 to 8,000 metric tons per year. These estimates include mercury that is re-emitted. The world map and the bar graph below provide information about the worldwide distribution of anthropogenic mercury emissions.
The U.S. is the third largest emitter of anthropogenic mercury.
Source: United Nations Environment Programme (UNEP), Global Mercury Assessment, 2013
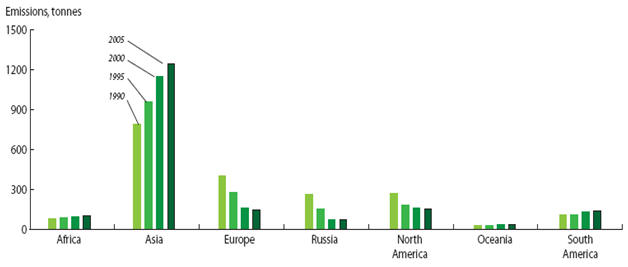
Anthropogenic mercury emissions from different regions from 1990-2005
2. Will Legislation Drive the need
Most developed countries control mercury from waste incineration. Some control air toxic emissions from other sources by segmentation into several toxicity categories.
History shows that when one country passes tough regulations for a particular pollutant other developed countries follow suit within a decade or two. Developing countries also will follow suit but not in the same time frame.
China already has Utility mercury reduction rules in effect for the next 5 year plan but they are lenient.
Chinese Regulations are Getting Tougher
China is not only setting tough air pollution limits but is also making the investments for compliance. It will retrofit 400,000 MW of SCR and add 250,000 MW of new SCR and FGD in the 2013-18 period. There is serious concern that electrostatic precipitators (ESP) will not meet the new particulate limits in key regions (20 mg/Nm3). Therefore some fabric filters are likely to be procured. There is a mercury limit on all boilers starting in 2015. It is much higher than the U.S. MATS limit but it is a start. The emission limits for major air pollutants are shown in Figure 1.
FIGURE 1 – CHINESE UTILITY BOILER AND GAS TURBINE EMISSION LIMITS
(Units mg/m3)
|
No. |
Type of Facility and Fuel |
Pollutant |
Conditions |
Limits |
|
1 |
Coal-fired boilers |
Particulate |
All |
30 |
|
Sulfur Dioxide (SO2) |
New Boilers |
100 200(1) |
||
|
Existing Boilers |
200 400(1) |
|||
|
Nitrogen Oxides (NOx) |
All |
100 200(2) |
||
|
Mercury |
All |
0.03 |
||
|
2 |
Oil-fired boilers or gas turbines |
Particulate |
All |
30 |
|
SO2 |
New boilers and gas turbines |
100 |
||
|
Existing boilers and gas turbines |
200 |
|||
|
NOx |
New oil-fired boilers |
100 |
||
|
Existing oil-fired boilers |
200 |
|||
|
Gas turbines |
120 |
|||
|
3 |
Gas-fired boilers or gas turbines |
Particulate |
Natural gas-fired boilers and gas turbines |
5 |
|
Other gas-fired boilers and gas turbines |
10 |
|||
|
SO2 |
Natural gas-fired boilers and gas turbines |
35 |
||
|
Other gas-fired boilers and gas turbines |
100 |
|||
|
NOx
|
Natural gas-fired boilers |
100 |
||
|
Other gas-fired boilers |
200 |
|||
|
Natural gas-fired turbines |
50 |
|||
|
Other gas-fired gas turbines |
120 |
Utility boilers and gas turbines located in key regions will implement special air pollutant emission limits set forth in Figure 2. The geographic scope of the key regions and timeline of the special limits are subject to MEP’s further regulation.
FIGURE 2 – EMISSION LIMITS FOR KEY REGIONS IN CHINA
(Unit mg/m3)
|
No. |
Type of Facility and Fuel |
Pollutant |
Conditions |
Limits |
|
1 |
Coal-fired boilers |
Particulate |
All |
20 |
|
SO2 |
All |
50 |
||
|
NOx |
All |
100 |
||
|
Mercury |
All |
0.03 |
||
|
2 |
Oil-fired boilers or gas turbines |
Particulate |
All |
20 |
|
SO2 |
All |
50 |
||
|
NOx |
Oil-fired boilers |
100 |
||
|
Gas turbines |
120 |
|||
|
3 |
Gas-fired boilers or gas turbines |
Particulate |
All |
5 |
|
SO2 |
All |
35 |
||
|
NOx |
Gas-fired boilers |
100 |
||
|
Gas turbines |
50 |
3. Does the U.S. have exportable technology?
The U.S. is ahead of other countries (Details will be discussed at the end of the presentation.)
4. How can this be exported?
Make other countries aware of the technology. McIlvaine is offering a free mercury decisions system to any operator of a boiler or furnace anywhere in the world.
Reach operators in other countries with webinars in their language.
Search Results
Mercury In Mandarin - YouTubewww.youtube.com/watch?v=ldq33k5UWTs
Aug 9, 2013 - Uploaded by McIlvaine Company
The speaker in Mandarin is Bobby Chen of CBI Shaw.
Decisively Classify the important subjects
|
Other Children of: |
|
|
Major Class |
Parent |
Descriptor |
Acronym |
Synonym |
Chinese Descriptor |
Reference |
Definition |
|
Product |
Catalyst Maintenance |
Cleaning Catalyst |
|
|
催化剂除灰 |
Coalogix |
A dry process that utilizes vacuum and compressed air to mechanically remove as much of the fly ash accumulation as possible. |
|
Product |
Catalyst Maintenance |
Regeneration Catalyst |
|
|
催化剂再生 |
Coalogix |
“Catalyst cleaning” followed by a wet chemical process to remove decay compounds plus re-impregnation of the catalytic compound(s). |
|
Product |
Catalyst Maintenance |
Rejuvenation Catalyst |
|
|
催化剂复原 |
Coalogix |
“Catalyst cleaning” followed by a wet chemical process to remove some decay compounds with minimum removal of catalytic compound(s). There is no re-impregnation of the catalytic compound(s). |
§ Identify the offshore decision makers with a financial entity number to eliminate the confusion.
|
Shanghai Fengwei Knitting Needle Manufacturing |
|
786 |
上海丰威织针制造有限公司 |
|
Shanghai Filtair Air Filter |
|
732 |
上海飞特亚空气过滤有限公司 |
|
Shanghai Flow Valve & Fitting |
|
1405 |
上海富乐阀门管件有限公 |
|
Shanghai GSD Industrial Co., Ltd. |
Chuanyuan Co., Ltd |
2797 |
上海华迪机械有限公司 |
|
Shanghai Huadi Machinery |
|
765 |
上海华迪机械有限公司 |
|
Shanghai Jinshang Autoparts |
|
782 |
上海锦尚汽摩配件有限公司 |
|
Shanghai Kaiquan |
§ Work with the in country magazine publishers and industry associations
§ Solicit support from U.S. government organizations such as EPA and DOC
§ Work with U.S. groups interested in expanding scope such as the Council of Industrial Boiler Owners and the Institute of Clean Air Companies ( ICAC)
§ Make sure the relative toxicity of mercury is properly assessed.
Environmental Burden Index(relative)
|
|
Tons of CO2 Equivalent |
QELD (lost per ton generated) |
|
2,3,7,8 TCDD Dioxin |
100,000,000 |
10,000,000 |
|
Mercury (air or water) |
10,000,000 |
1,000,000 |
|
Chromium Compounds |
1,000,000 |
100,000 |
|
Lead Compounds |
1,000,000 |
100,000 |
|
Arsenic |
1,000,000 |
100,000 |
|
One life lost |
350,000 |
35,000 |
|
Nickel Compounds |
100,000 |
10,000 |
|
Selenium Compounds |
100,000 |
10,000 |
|
Barium Compounds |
10,000 |
1,000 |
|
Zinc Compounds |
10,000 |
1,000 |
|
Vanadium Compounds |
10,000 |
1,000 |
|
Chlorine (water) |
10,000 |
1,000 |
|
Hydrochloric Acid (air) |
1,000 |
100 |
|
Sulfuric Acid |
1,000 |
100 |
|
Hydrogen Fluoride |
1,000 |
100 |
|
Ammonia (air) |
1,000 |
100 |
|
Ammonia (water) |
1,000 |
100 |
|
PM2.5 (air) |
1,000 |
100 |
|
SO2 |
100 |
10 |
|
CBOD5 (water) |
100 |
10 |
|
TSS (water) |
100 |
10 |
|
Nitrogen ( water) |
100 |
10 |
|
VOC |
100 |
10 |
|
NOx |
100 |
10 |
|
Methane |
23 |
2.3 |
|
CO2 |
1 |
0.1 |
|
Water resource depletion (drought area) |
0.1 |
0.01 |
|
Water resource depletion (deficit area) |
0.01 |
0.001 |
|
Oil resource depletion |
0.01 |
0.001 |
|
Landfill depletion (Europe) |
0.01 |
0.001 |
|
Coal resource depletion |
0.001 |
0.0001 |
|
Water resource depletion (surplus area) |
0.001 |
0.0001 |
|
Landfill depletion (U.S.) |
0.001 |
0.0001 |
This translates into an environmental burden index which shows that CO2 is only one of the pollutants. If you remove more mercury it is the equivalent of CO2 capture but at lower cost
The Sustainability Index and the Mercury Decisions will now be reviewed.